PUBLIC SURVEY DATA / UNITED STATES / 2022
U.S. Yoga Statistics: Participation & Demographics
In 2022, 16.9% of U.S. adults age 18 and older practiced yoga in the previous 12 months, using the CDC's age-adjusted estimate. That includes practice in a class or independently, not just studio customers.
Yoga participation in the United States, by the numbers
- Adults practicing yoga, age adjusted:
- 16.9%
- Women practicing yoga, age adjusted:
- 23.3%
- Adults ages 18-44 practicing yoga:
- 21.3%
The national estimate comes from CDC/NCHS Data Brief 501, published in June 2024 using the 2022 National Health Interview Survey (NHIS). Its 95% confidence interval is 16.3% to 17.5%. These are survey estimates about adults' behavior, not a count of yoga businesses, memberships, instructors, or paid bookings.
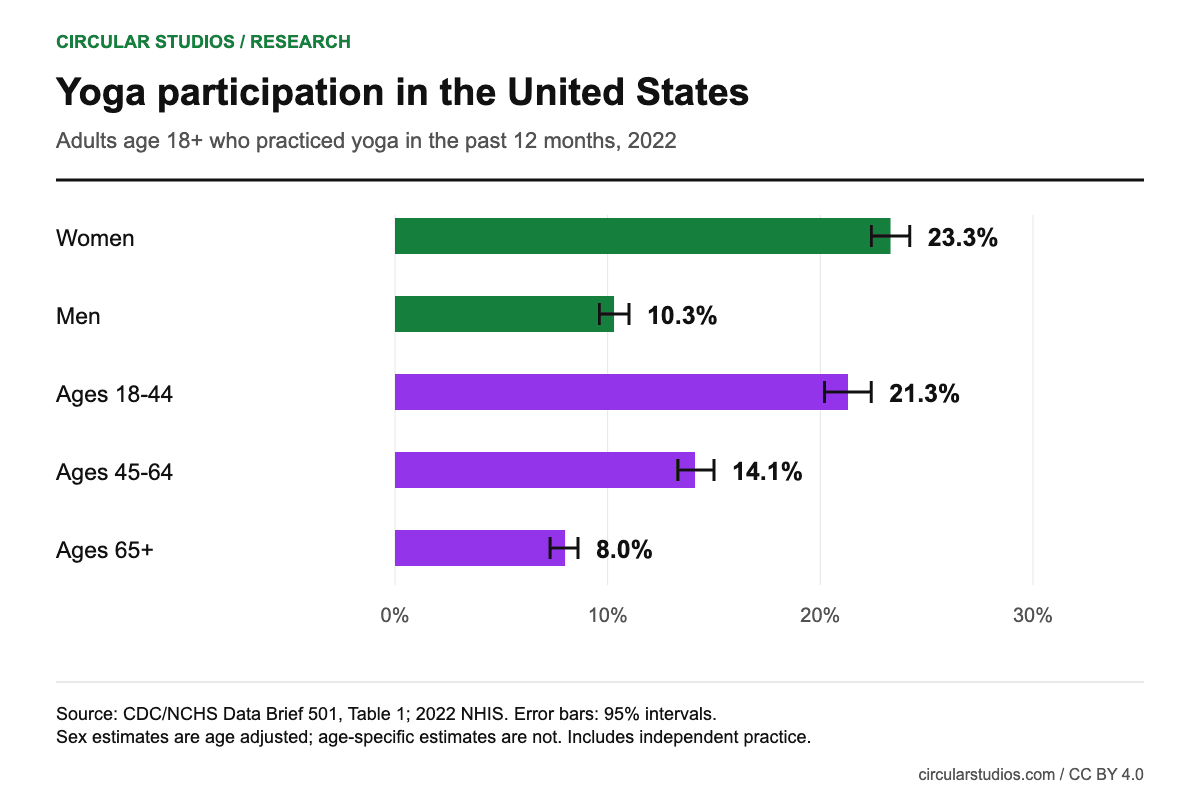
- Women: 23.3%; men: 10.3%. These age-adjusted participation estimates differ by 13.0 percentage points, calculated from the published table. A percentage-point difference is not a 13% relative increase. The CDC reports a statistically significant sex difference.
- Ages 18-44: 21.3%; ages 45-64: 14.1%; ages 65 and older: 8.0%. These age-specific rows are not age adjusted. They describe participation within each age group, not the age distribution of all practitioners.
- Family income matters to the observed pattern. Participation was 10.4% below 200% of the federal poverty level (FPL), 14.0% at 200% to less than 400% FPL, and 23.0% at 400% FPL or more. The survey does not establish that class prices caused this difference.
Source for all three comparisons: CDC Table 1. Reference year: 2022. A newer publication date does not make these 2026 observations.
Yoga statistics by sex, age, race and family income
The complete demographic extract is below, including uncertainty. The categories answer different questions: a group's participation rate cannot be added to another group's rate, and it is not the percentage of yoga practitioners who belong to that group. Source: CDC Table 1.
| Group / characteristic | Percent | 95% confidence interval | Standard error | Age adjusted? |
|---|---|---|---|---|
| All adults | 16.9% | 16.3-17.5% | 0.4 | Yes |
| Sex: Men | 10.3% | 9.6-11.0% | 0.4 | Yes |
| Sex: Women | 23.3% | 22.4-24.2% | 0.5 | Yes |
| Age group: 18–44 | 21.3% | 20.2-22.4% | 0.5 | No |
| Age group: 45–64 | 14.1% | 13.3-15.0% | 0.4 | No |
| Age group: 65 and older | 8.0% | 7.3-8.6% | 0.3 | No |
| Race and Hispanic origin: Asian, non-Hispanic | 22.5% | 20.2-24.9% | 1.2 | Yes |
| Race and Hispanic origin: Black, non-Hispanic | 12.6% | 11.2-14.1% | 0.8 | Yes |
| Race and Hispanic origin: White, non-Hispanic | 19.3% | 18.5-20.1% | 0.5 | Yes |
| Race and Hispanic origin: Other and multiple races, non-Hispanic | 15.7% | 12.8-19.0% | 1.5 | Yes |
| Race and Hispanic origin: Hispanic | 10.5% | 9.3-11.7% | 0.6 | Yes |
| Family income: Less than 200% FPL | 10.4% | 9.6-11.2% | 0.5 | Yes |
| Family income: 200% to less than 400% FPL | 14.0% | 13.1-14.9% | 0.5 | Yes |
| Family income: 400% FPL or more | 23.0% | 22.0-24.0% | 0.5 | Yes |
FPL is a family-income-to-poverty-threshold ratio, not a fixed salary bracket. Hispanic adults may be of any race. The other race categories are non-Hispanic. Standard errors and intervals are reproduced as published; they are not recalculated from rounded estimates.
For an operator, this is a reason to investigate access and the intended audience, not to stereotype individual customers or copy a national demographic profile into every city. A neighborhood's age structure, travel patterns, competing programs, and class formats require local evidence. The survey does not measure how far a person travels, whether they pay for yoga, or what style they practice.
National differences also do not establish which location will be profitable. A high participation rate and an expensive lease can coexist. Use the studio break-even calculator to separate an operating-cost scenario from an assumption about demand.
Why adults reported practicing yoga
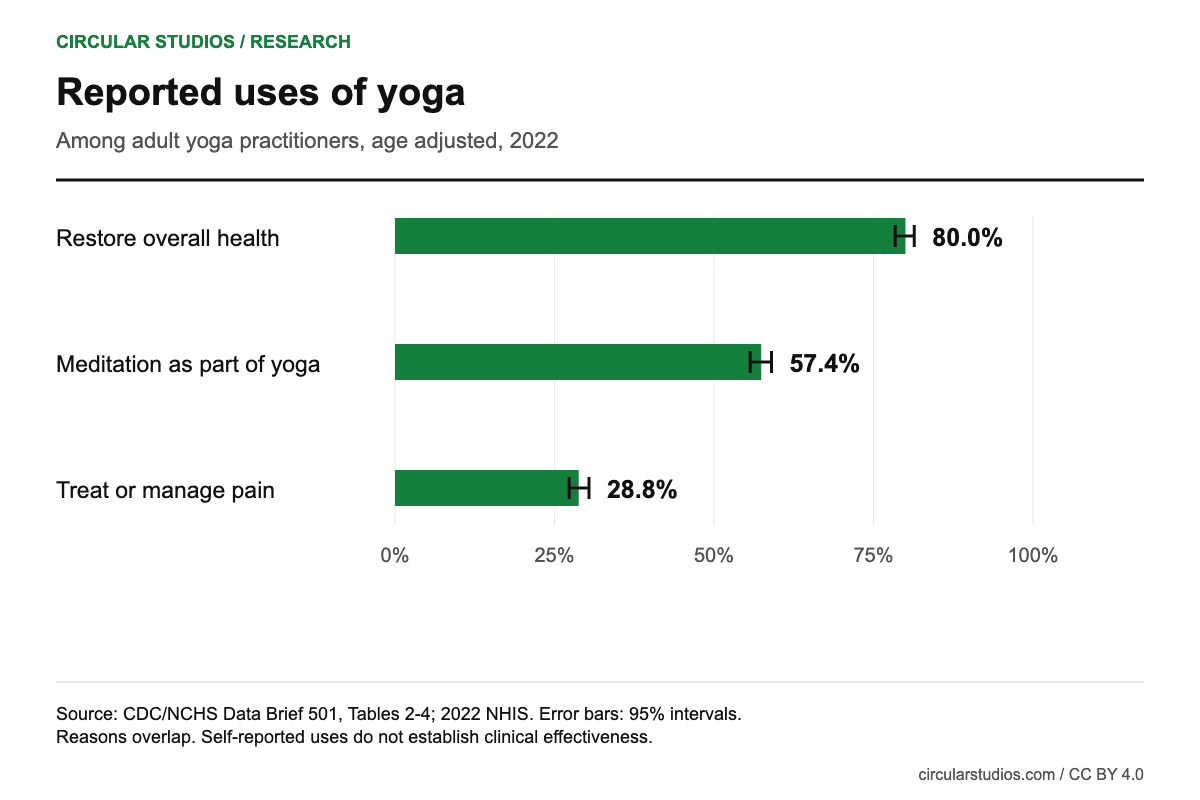
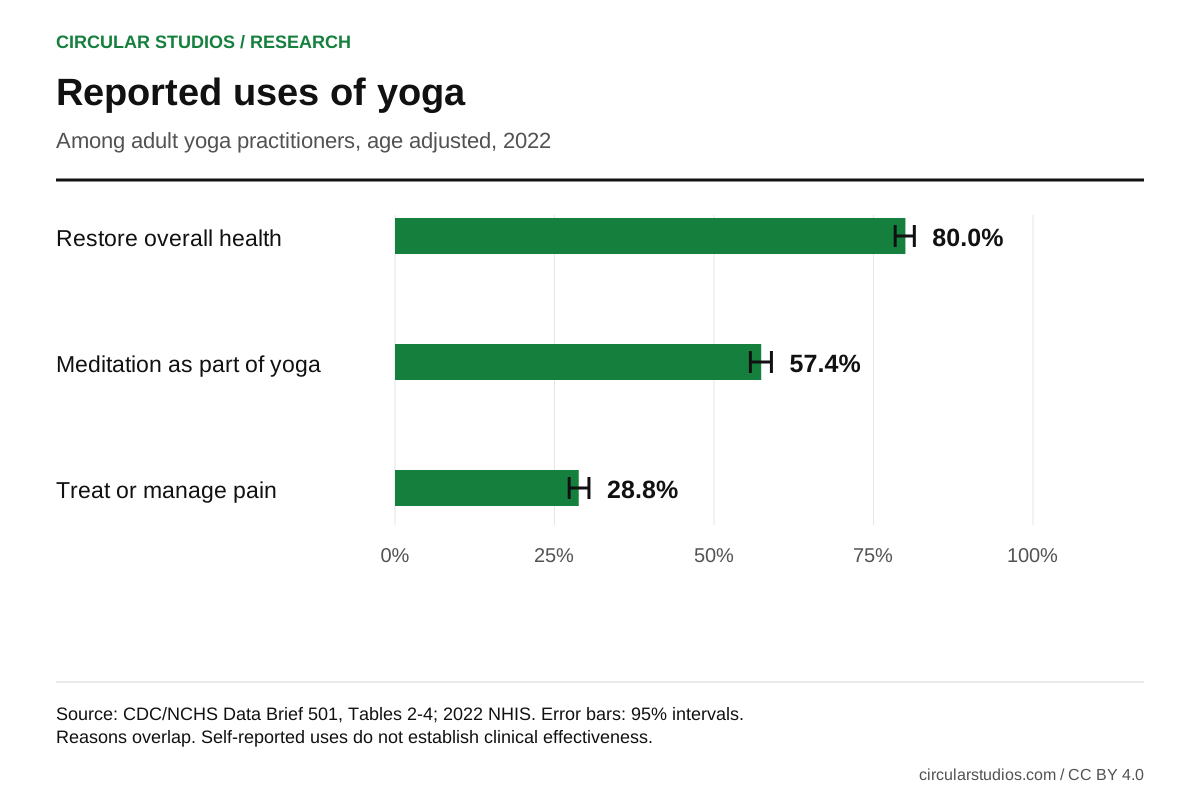
Among adults who practiced yoga, 80.0% reported using it to restore overall health, 57.4% included meditation, and 28.8% reported using it to treat or manage pain. These are age-adjusted estimates among practitioners, not percentages of all adults. A respondent could report more than one reason. Sources: CDC Tables 2-4.
Self-reported reasons are not clinical outcomes. This report does not establish whether yoga treated a condition, recommend a treatment, or measure teacher qualifications. For a studio's public description, explain the class format and accessibility honestly rather than turning a population survey into a health promise.
| Reported use | Percent | 95% confidence interval | Standard error |
|---|---|---|---|
| Restore overall health | 80.0% | 78.4-81.4% | 0.8 |
| Meditation as part of yoga | 57.4% | 55.7-59.0% | 0.8 |
| Treat or manage pain | 28.8% | 27.3-30.4% | 0.8 |
Why some yoga statistics say 15.8% and others say 16.9%
NCCIH's separately published trend chart reports yoga use of 5.0% in 2002 and 15.8% in 2022. The CDC report used here explicitly age adjusts its overall estimate and reports 16.9% for 2022. These are different published series. Keep the source and adjustment with the number; do not treat them as interchangeable or splice one endpoint into the other series.
In the NCCIH series, the displayed endpoints differ by 10.8 percentage points. That is a calculation from its rounded published values, not a newly estimated annual growth rate. There are no observations for the intervening years in our downloadable extract, so we do not draw a smooth year-by-year growth line.
An age-adjusted estimate standardizes the age mix for comparison; it is not simply the observed share multiplied by today's adult population. We therefore do not turn 16.9% into a precise headcount of U.S. practitioners. Neither figure reveals how many people bought a studio membership or attended a class every week.
The downloadable JSON preserves NCCIH's two observations separately. The main CSV contains the CDC demographic and reason estimates, with adjustment flags and source-table numbers.
What yoga participation does and does not say about studio demand
Practicing at home, joining a community session, following a video, and paying for a studio class can all fit the NHIS participation question. Counting every practitioner as a potential paying studio member would overstate what the source supports. Frequency, spending, subscriptions, location, and preferred class style are not established by these tables.
For local research, define the actual offer first: beginner classes, heated practice, restorative sessions, private instruction, or rentable teaching space are not equivalent products. Then identify operators offering something comparable and ask for current schedules, pricing units, registration terms, and accessibility information. Our yoga directory is a way to find listed operators, not an exhaustive market census.
A studio owner's useful contribution is current, first-hand information about their own space. Listing a business does not validate a national statistic. National evidence, local offer details, and projected financial performance belong in separate parts of a business plan. The studio rental comparison worksheet helps keep the local details consistent.
The dance participation report shows why definitions matter across disciplines too: social participation, paid lessons, and performance attendance are different measures. Its percentages are not directly comparable to this age-adjusted yoga rate.
Methodology, uncertainty and limitations
This is an editorial analysis and selected extract of published federal survey results, not a Circular Studios survey or a reanalysis of respondent-level records. NHIS covers the civilian noninstitutionalized U.S. population. The results shown here are for adults age 18 and older and use self-reported activity in the preceding 12 months.
CDC standardizes estimates to the projected 2000 U.S. population using age groups 18-44, 45-64, and 65 and older. Age-specific rows are not adjusted. The source accounts for NHIS's complex survey design; we preserve its point estimates, 95% intervals, and standard errors. We do not perform new significance tests or infer that every numerical difference is statistically significant.
Our extractor reads CDC's four HTML tables and checks the selected estimates. The JSON retains source URLs, adjustment notes and the separate NCCIH trend series. The public source manifest provides checksums and retrieval dates for the original files. The chart is a new visualization of the published estimates, not a copied government graphic.
There is no city-level yoga participation estimate, paid-studio enrollment estimate, market-size dollar value, or forecast in this release. Those omissions are deliberate: the available tables do not support them. A future update should use a verified release with compatible definitions, not simply advance the year in the title.
Download the data and cite this report
The CSV is a selected extract of published estimates, not respondent-level survey data. The JSON adds definitions and source notes. Our original analysis and graphics use CC BY 4.0. Credit Circular Studios and identify any changes. Federal source data remain public domain; we do not claim to have conducted the surveys.
Circular Studios. (October 3, 2026). U.S. Yoga Statistics: Participation & Demographics. https://circularstudios.com/research/yoga-statistics. Analysis of published 2022 survey estimates.
For a correction, missing source detail, or a question about reuse, contact Circular Studios. We check the evidence before updating a number; the date above records this release, not a claim that the underlying data were collected in 2026.
Sources and editorial notes
- CDC/NCHS Data Brief 501: Yoga Among Adults Age 18 and Older. June 2024; 2022 NHIS. Tables 1-4, definitions, and methods. Primary demographic and practitioner-reason estimates.
- NCCIH: Yoga Use, 20-Year Trends. Separately published 2002/2022 estimates: 5.0% and 15.8%. Not merged with the CDC age-adjusted series.
- NCCIH: Statistics From the National Health Interview Survey. Survey context and complementary-health modules. Module years are not annual observations.
Primary sources checked for this release. Survey findings, our calculations, and illustrative operating assumptions are labeled separately. Paid placements do not determine these findings or the selection of sources.
More studio research and planning resources
Find yoga studios near you
National research cannot establish what a particular neighborhood needs or whether a venue has space available. Use a city directory to identify operators, then confirm current services, pricing, access, and booking terms directly.
Browse all yoga studio locations. Coverage is our directory inventory, not a national census.
Own a studio? List or claim your space for a free name, address, and phone listing, reviewed by our admin. A paid full listing can include your website and social links; Featured remains $49/month or $399/year. Publishing this research does not imply any venue endorsement.