PUBLIC SURVEY DATA / UNITED STATES / 2022
U.S. Dance Statistics: Participation, Lessons & Attendance
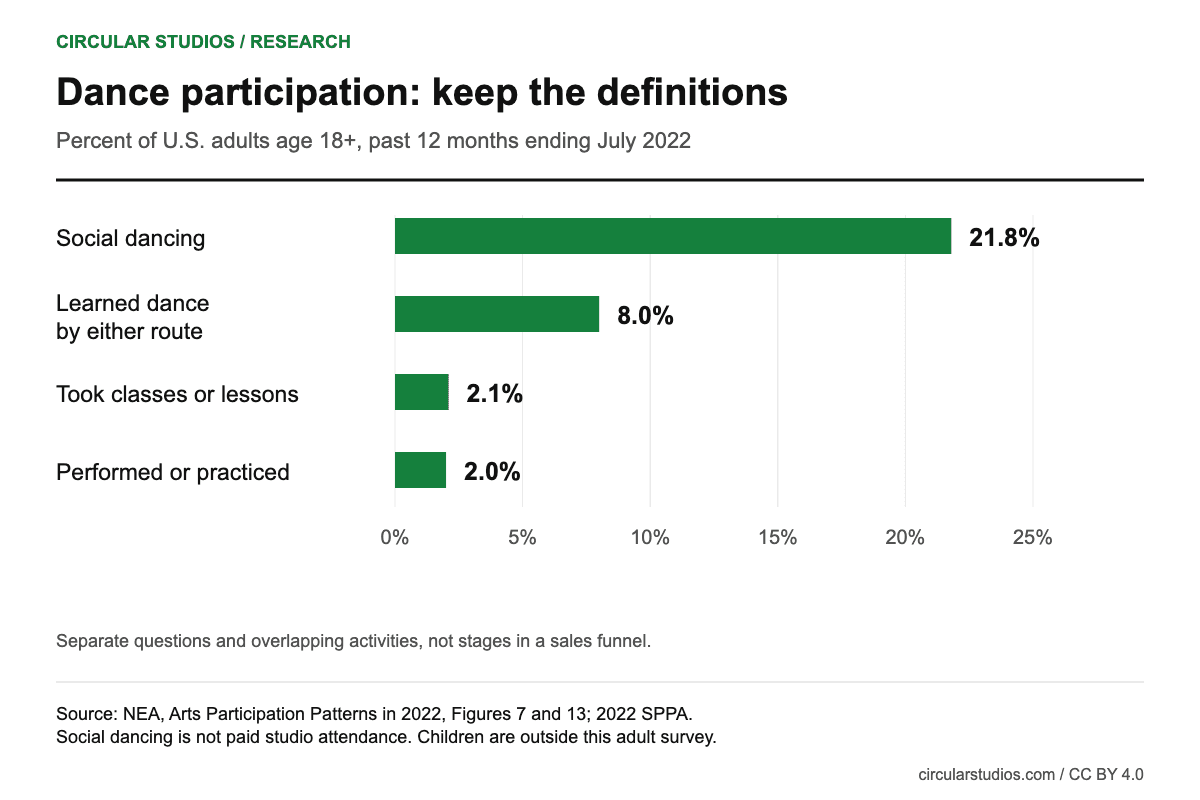
In the 2022 federal arts survey, 21.8% of U.S. adults reported social dancing, while 2.1% reported dance classes or lessons. Those are different activities, not competing estimates of the same market.
Dance participation statistics at a glance
- Adults reporting social dancing:
- 21.8%
- Adults taking dance classes or lessons:
- 2.1%
- Adults learning dance by either route:
- 8.0%
The source is the National Endowment for the Arts' Arts Participation Patterns in 2022, published in October 2023. The Survey of Public Participation in the Arts (SPPA) was fielded as a supplement to the Census Bureau's Current Population Survey in July 2022. Activities refer to the preceding 12 months and adults age 18 and older, not children.
- 21.8% reported social dancing. The activity includes settings such as weddings and clubs. It does not mean that one in five adults paid a dance studio. Source: Figure 7.
- 2.0% reported performing or practicing dance. This is a separately asked creation/performance activity. It is not an exclusive segment to subtract from social dancers. Source: Figure 7.
- 2.1% learned dance through classes or lessons; 6.7% learned by other means. The combined participation estimate is 8.0%, not 8.8%, because people can use both routes. Source: Figure 13.
- 2.0% attended ballet; 3.3% attended other dance in person. Audience attendance is distinct from dancing or studying dance. Source: Figure 3.
Percentages describe different, overlapping activities. Do not add them into a total dance market, convert them into studio revenue, or compare them as a single funnel.
Social dancing, practice, lessons and audiences are different measures
A useful dance statistic keeps the verb with the number. Someone who watched a performance is not necessarily a dancer; someone who danced at a wedding is not necessarily a student. The following extract keeps each activity's definition and original figure number beside the estimate.
| Activity | Percent | What is measured | NEA figure |
|---|---|---|---|
| Social dancing | 21.8% | Social dancing at weddings, clubs, or other social settings | 7 |
| Perform or practice dance | 2.0% | Personal performance or practice; separate from social dancing | 7 |
| Dance classes or lessons | 2.1% | Learning dance through classes or lessons | 13 |
| Dance learning by other means | 6.7% | Learning through friends, family, self-teaching, or other means | 13 |
| Dance learning by either route | 8.0% | Union of classes/lessons and other learning; not their sum | 13 |
| Ballet attendance | 2.0% | In-person attendance; omit elementary, middle, and high school student groups | 3 |
| Other dance attendance | 3.3% | In-person attendance at non-ballet dance; not a count of dancers | 3 |
| Dance performances via media | 9.9% | Watching or listening through electronic/digital media | 12 |
The source presents rounded percentages; we do not invent extra precision or confidence intervals. Different questions belong to different survey components. These rates are not directly comparable with age-adjusted NHIS yoga estimates.
How many adults took dance lessons?
2.1% of U.S. adults reported learning dance through classes or lessons in the 2022 SPPA period. Another published measure, 6.7%, describes learning by other means such as friends, family, or self-teaching. The survey reports 8.0% for learning by either route. Source: Figure 13.
The difference between adding the rounded route estimates (8.8%) and the reported union (8.0%) is about 0.8 percentage points. That is an illustrative overlap calculation from rounded estimates, not a newly estimated precise share. The important fact is that learners can appear in both groups. Calling the union a paid-lesson participation rate would erase the distinction the survey makes.
For a dance school, these figures establish that formal and informal learning coexist. They do not establish the number of prospective local students, how often people attended, which dance styles they studied, what they paid, or whether lessons took place in a commercial studio. Children's classes are outside the adult population measured here.
That leaves practical questions for local research: beginner versus advanced instruction, individual versus group lessons, ages served, class schedule, travel distance, and the enrollment unit. A monthly membership and a multiweek course cannot be compared by headline price alone. The space and quote comparison worksheet offers a consistent way to check a venue; its criteria are operational guidance, not survey findings.
Dance audiences: 2017 versus 2022
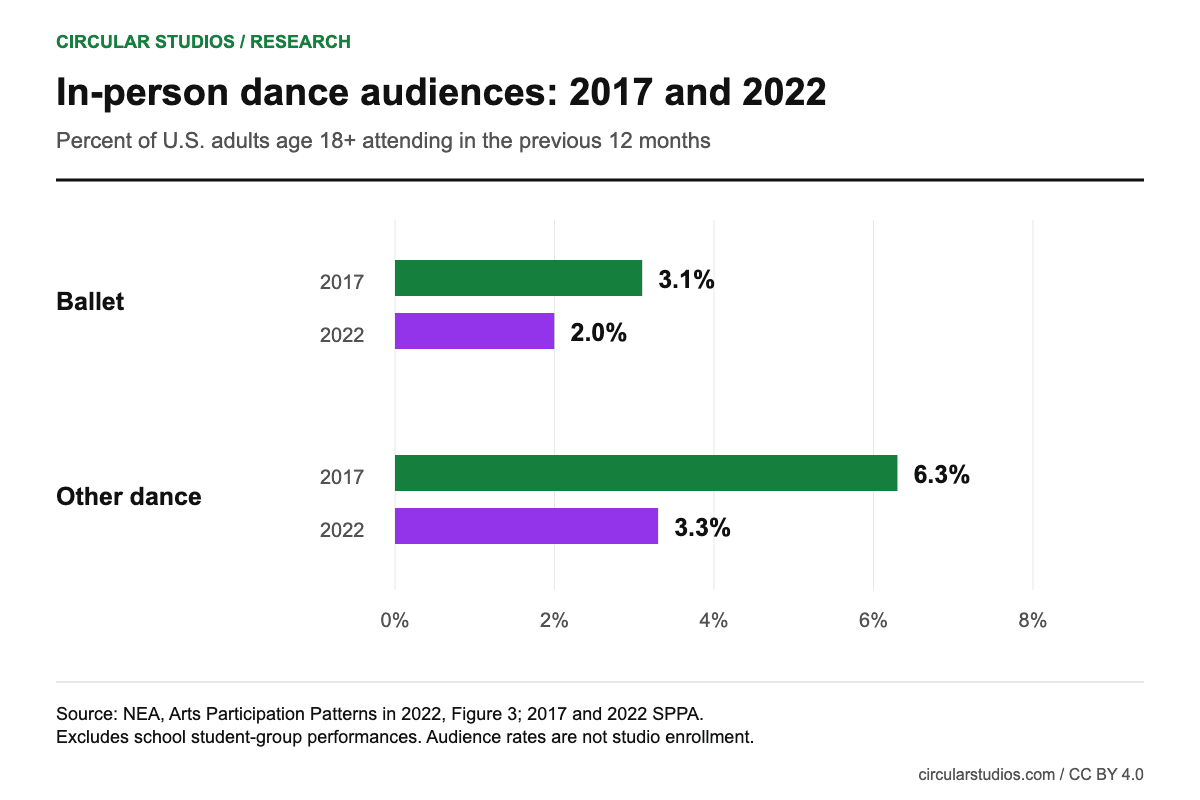
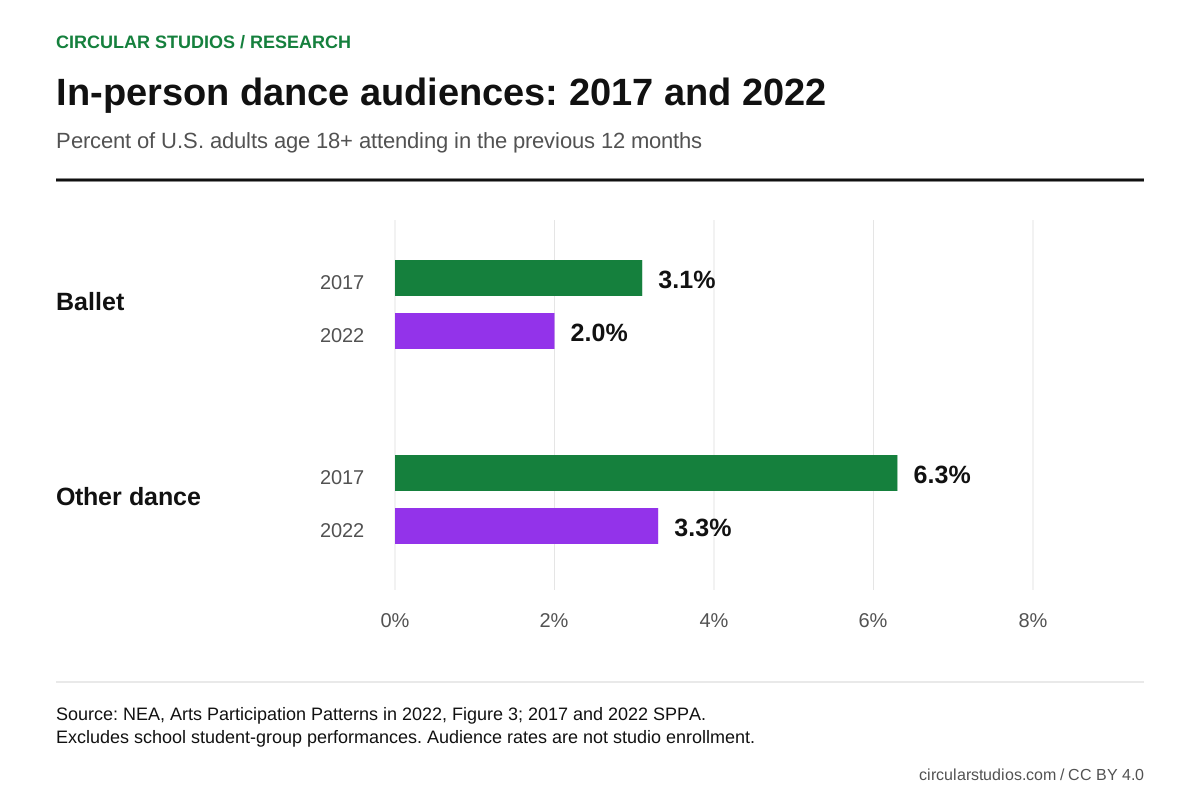
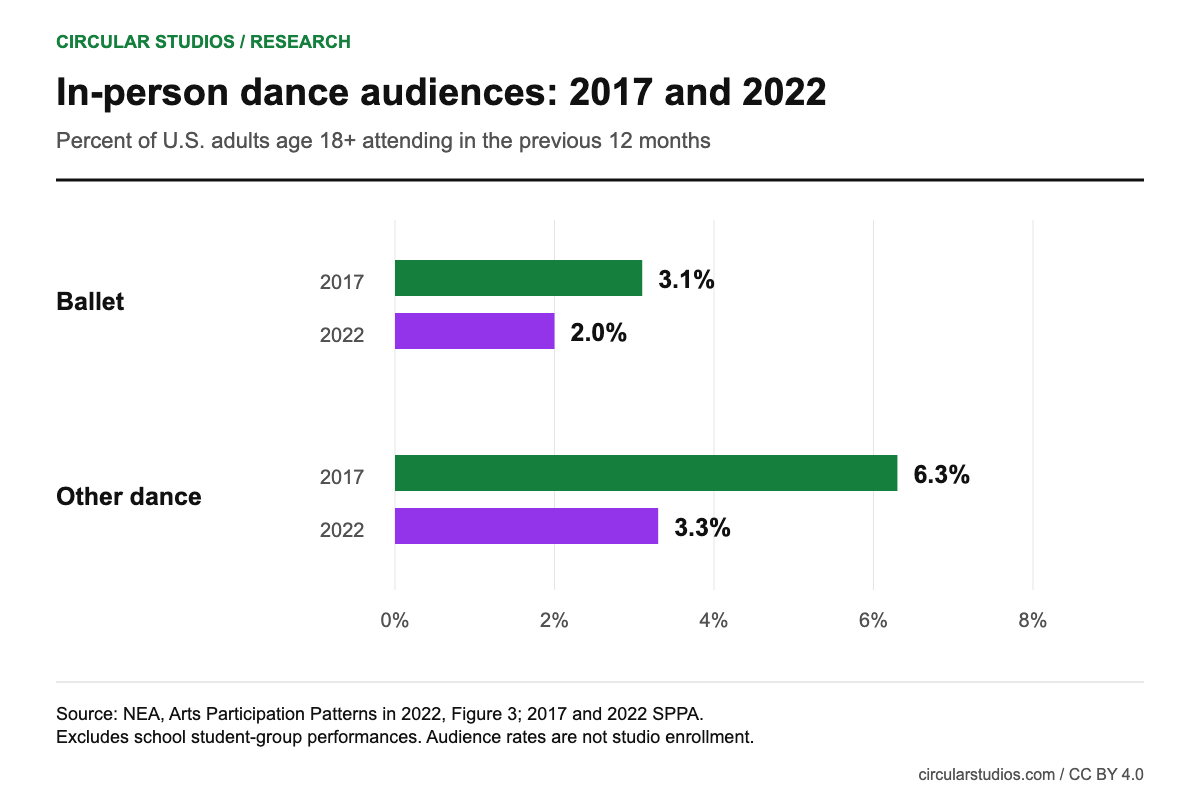
The published ballet attendance rate was 3.1% in 2017 and 2.0% in 2022. Other dance attendance was 6.3% and 3.3%, respectively. NEA reports both decreases as statistically significant under its 90% confidence convention. These measures omit performances by elementary, middle, and high school student groups. Source: Figure 3 and its attendance notes.
The reference period included pandemic-era conditions. This before-and-after comparison does not isolate a cause or establish what happened after July 2022. It cannot support a headline saying dance studios are declining today: an audience measure is not a business-location count, lesson enrollment, or a current sales trend.
| Attendance | 2017 | 2022 | Published change (points) | Published relative change |
|---|---|---|---|---|
| Ballet | 3.1% | 2.0% | -1.2 | -37% |
| Other dance | 6.3% | 3.3% | -3.0 | -48% |
Published changes can differ from subtracting or dividing the displayed endpoints because the estimates are rounded. For example, NEA publishes a 1.2-percentage-point ballet decrease, rather than the 1.1 points obtained from 3.1 minus 2.0. Keep the official change with its source; do not silently replace it with a calculation using less precise inputs.
Dance also reaches an audience through media: 9.9% of adults reported watching or listening to dance performances through electronic or digital media in 2022 (Figure 12). That is a separate route, not an extra group to add to in-person attendance. A person can do both, and neither route identifies paid rehearsal-space demand.
How participation connects to the dance studio market
Participation measures the demand side only loosely: it describes activities, not purchases. The supply side needs a business definition. Our U.S. fine arts school statistics use Census NAICS 611610, which includes dance, music, drama, and art instruction. Its 16,284 employer establishments in 2023 must not be relabeled as 16,284 dance studios.
Putting those sources next to each other clarifies the gap rather than closes it. The SPPA does not count teaching locations, and the Census fine arts category does not isolate dance providers or independent teachers. Neither tells us how many rehearsal rooms accept outside bookings. A directory is another kind of evidence: useful for identifying businesses, but limited by its coverage and verification.
For a local plan, decide whether the offer is instruction, independent rehearsal time, a performance venue, or some combination. Check comparable businesses, current enrollment and booking terms, floor use, sound restrictions, and available hours directly. Our dance studio directory helps find listed operators; it is not a statistically representative sample or a ranking of business opportunity.
Then test the operating model separately. The studio break-even calculator uses entered costs and capacity to estimate the sales volume required. It does not assume that a national participation percentage will translate into those sales.
Methodology and what this report cannot tell us
The SPPA was administered in July 2022, with a total sample of 40,718 U.S. adults age 18 and older. NEA reports that 23.2% were represented by proxy respondents and a person response rate of 59.1%. The full sample is not the sample size for every statistic: question modules and components differ. Core 1, for example, was administered to 6,578 respondents. See the source's Methods section, printed page 3.
We extracted selected rows from Figures 3, 7, 12 and 13 of the original NEA report. The JSON includes source-row text and figure references; the CSV contains the eight activity estimates and definitions. A checksummed manifest identifies the original PDF. Charts are original visualizations of published estimates, not original survey research.
Question wording and placement changed across some survey years, limiting trend comparisons. We do not invent a 2017 social-dancing baseline where Figure 7 lists it as unavailable, or combine the 2020 Arts Basic Survey with the 2022 SPPA as if they were an annual census. The historical chart uses the comparable attendance estimates actually published by NEA.
The national estimates do not identify studio revenue, tuition, booking frequency, local supply gaps, or dance participation among children. They also do not establish a direct comparison with yoga participation statistics, which use a different survey, question, reference period, and adjustment method. Keep those limitations attached when citing or adapting the data.
Download the data and cite this report
The CSV is a selected extract of published estimates, not respondent-level survey data. The JSON adds definitions and source notes. Our original analysis and graphics use CC BY 4.0. Credit Circular Studios and identify any changes. Federal source data remain public domain; we do not claim to have conducted the surveys.
Circular Studios. (October 3, 2026). U.S. Dance Statistics: Participation, Lessons & Attendance. https://circularstudios.com/research/dance-participation-statistics. Analysis of published 2022 survey estimates.
For a correction, missing source detail, or a question about reuse, contact Circular Studios. We check the evidence before updating a number; the date above records this release, not a claim that the underlying data were collected in 2026.
Sources and editorial notes
- NEA: Arts Participation Patterns in 2022 (original report). October 2023; July 2022 SPPA. Figures 3, 7, 12 and 13; Methods, printed page 3. These are adult survey estimates, not business counts.
- NEA: Report, supplemental tables and survey resources. Official publication landing page. Check question wording and module-specific sample sizes before further comparisons.
Primary sources checked for this release. Survey findings, our calculations, and illustrative operating assumptions are labeled separately. Paid placements do not determine these findings or the selection of sources.
More studio research and planning resources
Find dance studios near you
National research cannot establish what a particular neighborhood needs or whether a venue has space available. Use a city directory to identify operators, then confirm current services, pricing, access, and booking terms directly.
Browse all dance studio locations. Coverage is our directory inventory, not a national census.
Own a studio? List or claim your space for a free name, address, and phone listing, reviewed by our admin. A paid full listing can include your website and social links; Featured remains $49/month or $399/year. Publishing this research does not imply any venue endorsement.