RESEARCH / NAICS 611610 / 2023 DATA
U.S. Fine Arts School Statistics
The U.S. had 16,284 fine arts school locations with paid employees in 2023. This is a useful benchmark for dance operators, but it also includes music, drama, and art instruction. It is not a dance-only market count.
The fine arts school employer footprint
- Employer establishments (2023):
- 16,284
- Employees (mid-March 2023):
- 127,068
- Employer locations, change since 2019:
- +5.2%
What is being counted: Fine arts schools (NAICS 611610) includes dance, music, drama, and art instruction. These figures are not a dance-only count and exclude businesses without paid employees. Census: definition of fine arts schools, NAICS 611610.
- 16,284 employer locations supported 127,068 employees in 2023, with $2,515,444,000 in annual payroll. Employees include all occupations; payroll is not revenue. Census: 2023 County Business Patterns.
- 50.4% of employer locations had fewer than five employees. That is 8,208 of 16,284 establishments in the published size bands. Small does not mean new, owner-operated, or unprofitable. Census: 2023 County Business Patterns.
- California had the most employer locations (2,336), but Vermont led on locations per resident. Vermont had 8.95 per 100,000 residents, compared with 4.84 nationally. This is our calculation from Census: 2023 County Business Patterns and Census: state population estimates, Vintage 2025.
Industry reference year: 2023, the latest CBP and NES releases found during this review. Population denominator: July 2023, revised in Vintage 2025. The publication date is not the data year.
Planning a space? Use the studio break-even calculator and rental quote worksheet. Dance participation statistics cover the demand-side survey definitions separately.
Locations and employment grew at different rates
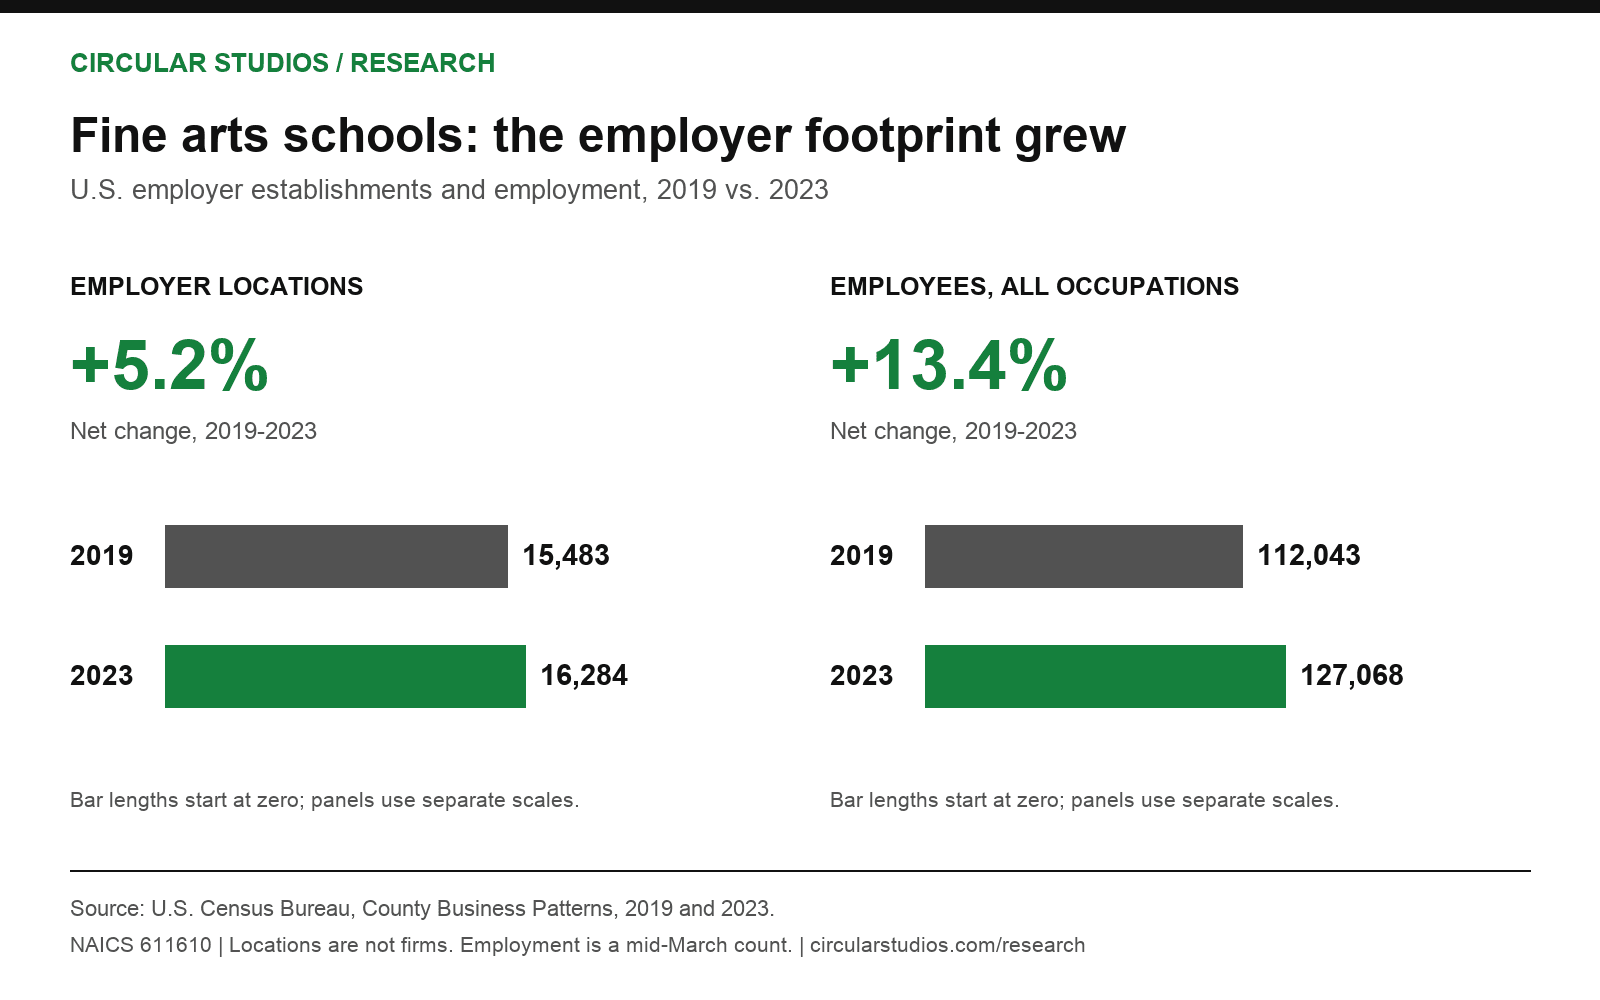
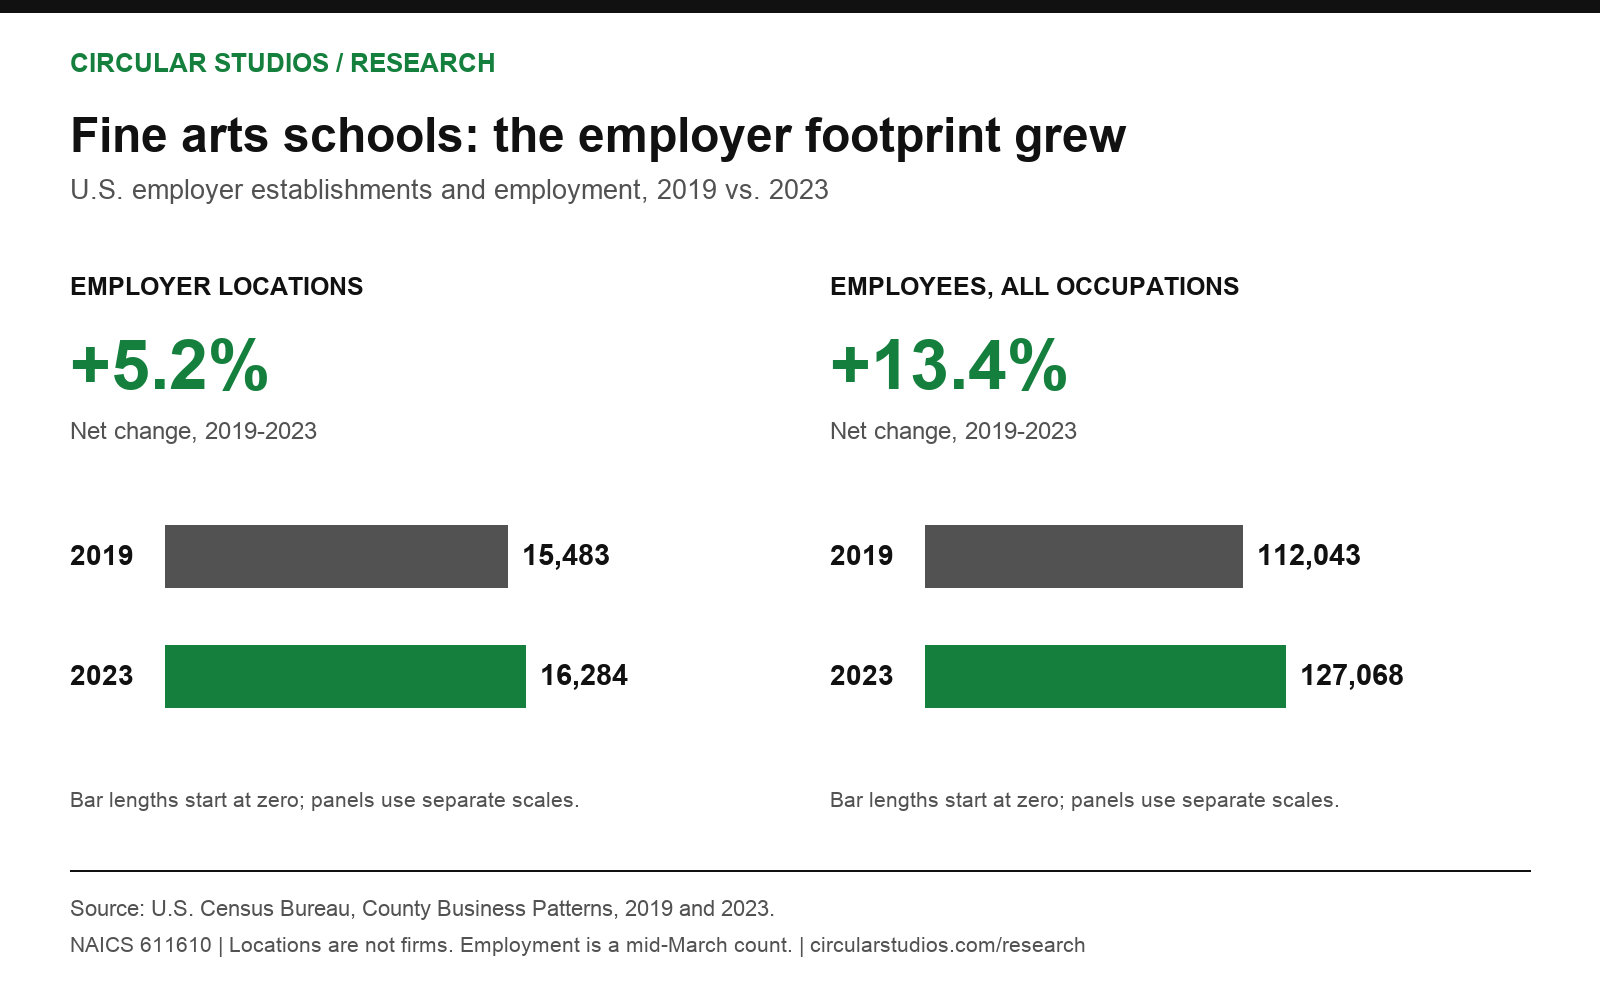
Between 2019 and 2023, fine arts school employer establishments increased from 15,483 to 16,284, an increase of 5.2%. Over the same period, employment rose from 112,043 to 127,068, up 13.4%. Calculations use the annual CBP national files listed in the source manifest.
By 2023, both published measures were above their 2019 levels. The category spans several kinds of instruction, so this growth cannot be attributed specifically to dance studios. Nor does a higher location count tell us whether individual schools became more profitable.
| Year | Employer locations | Employees | Annual payroll | Locations with <5 employees |
|---|---|---|---|---|
| 2019 | 15,483 | 112,043 (G) | $1,924,585,000 (G) | 8,395 |
| 2020 | 15,714 | 115,178 (G) | $1,739,441,000 (G) | 8,424 |
| 2021 | 15,531 | 101,495 (G) | $1,955,469,000 (G) | 8,647 |
| 2022 | 15,991 | 119,606 (G) | $2,323,136,000 (G) | 8,289 |
| 2023 | 16,284 | 127,068 (G) | $2,515,444,000 (G) | 8,208 |
Employment is measured around mid-March, not averaged across the year. Annual payroll covers the calendar year and is not inflation-adjusted. G/H/J flags reflect Census disclosure protection; see methodology. Net establishment change is not a startup birth or survival rate.
Fine arts school statistics by state
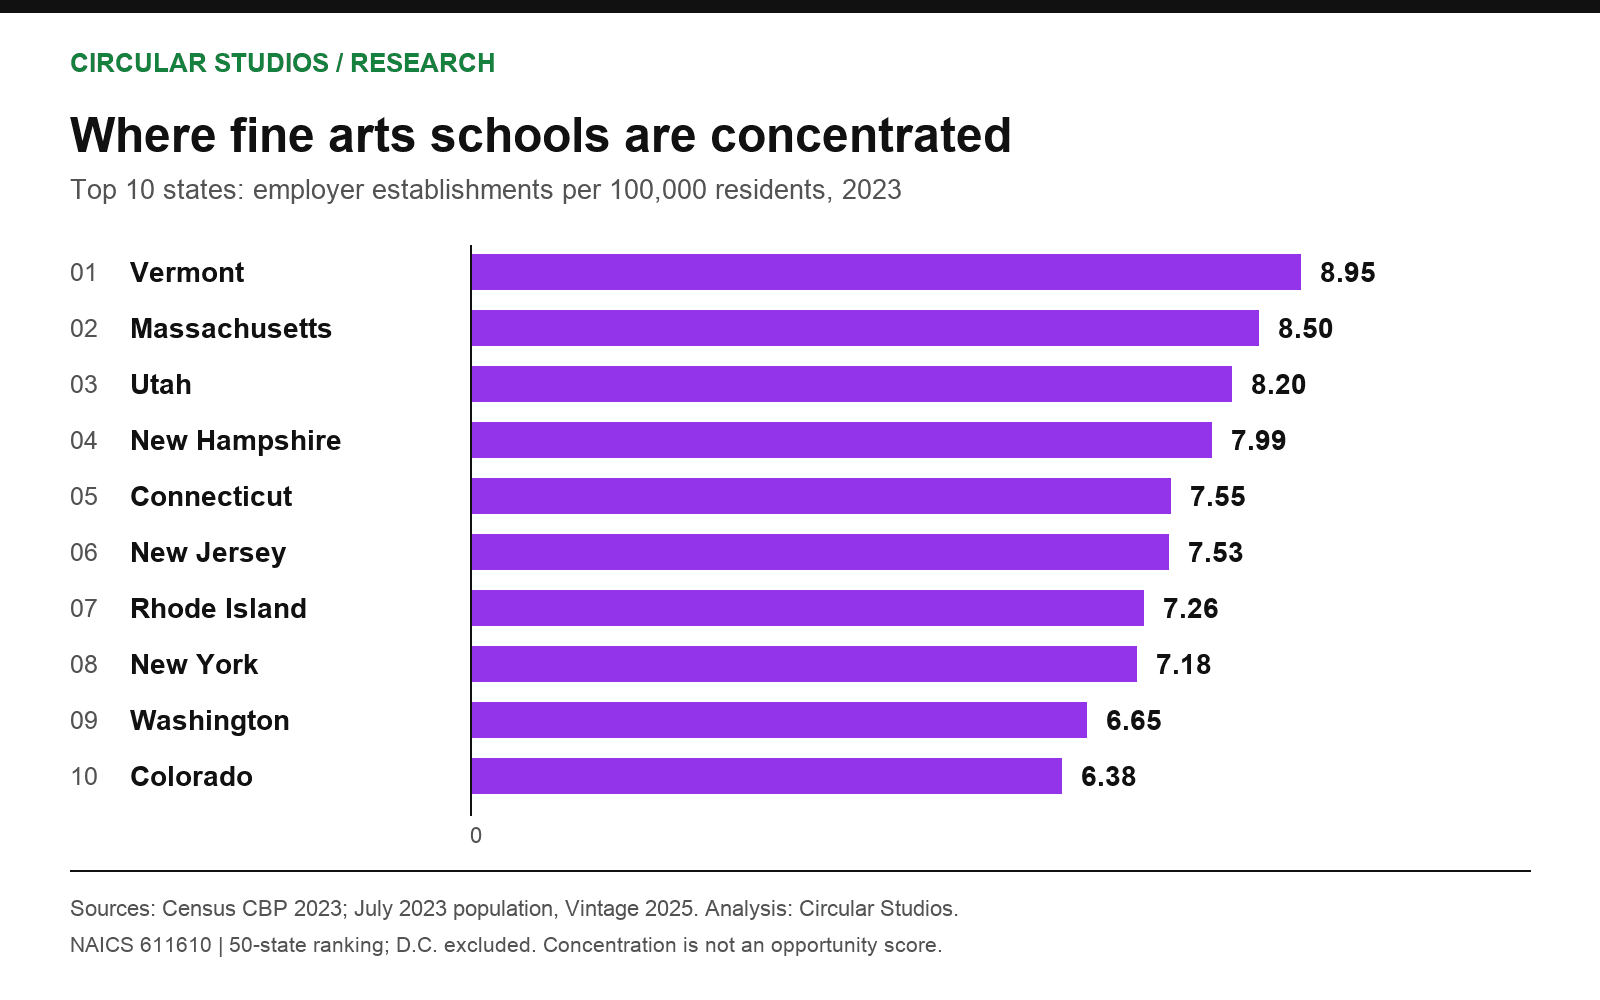
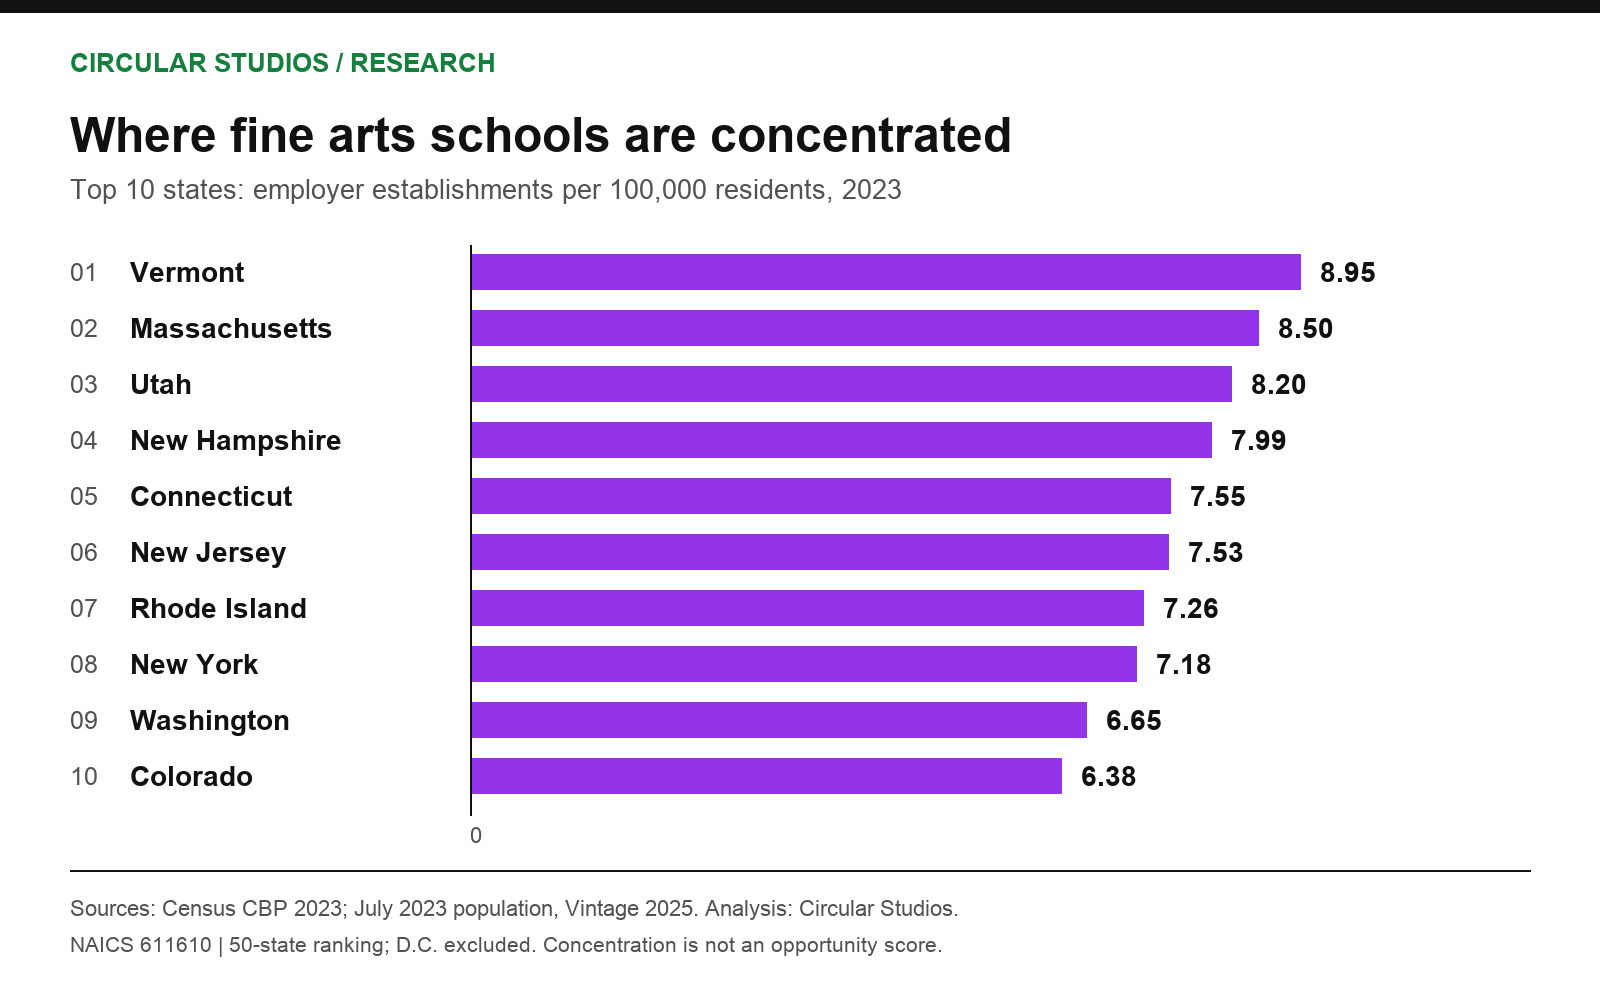
Vermont (8.95), Massachusetts (8.50), Utah (8.20) lead the 50-state comparison for employer locations per 100,000 residents. Population adjustment changes the picture from a ranking by raw business count. Census: 2023 County Business Patterns; Census: state population estimates, Vintage 2025.
A high ratio can reflect many different conditions, including local demand, tourism, or business structure. We have not tested those explanations. It is not a ranking of the best places to start a studio, and state averages can hide large differences between cities.
51 of 51 areas
| State / district | Employer locations | Per 100,000 residents | Locations, 2019-2023 change | Employees |
|---|---|---|---|---|
| Alabama | 153 | 2.99 | +1.3% | 1,042 (G) |
| Alaska | 39 | 5.31 | +5.4% | 226 (G) |
| Arizona | 281 | 3.77 | +7.3% | 1,790 (G) |
| Arkansas | 107 | 3.49 | +12.6% | 545 (G) |
| California | 2,336 | 5.96 | +17.7% | 21,002 (G) |
| Colorado | 377 | 6.38 | +4.7% | 2,612 (G) |
| Connecticut | 275 | 7.55 | +6.2% | 2,065 (G) |
| Delaware | 55 | 5.31 | +5.8% | 466 (H) |
| District of Columbia | 41 | 6.01 | -8.9% | 568 (H) |
| Florida | 896 | 3.91 | +6.7% | 4,426 (G) |
| Georgia | 400 | 3.62 | +3.1% | 2,252 (G) |
| Hawaii | 59 | 4.11 | -10.6% | 319 (H) |
| Idaho | 76 | 3.86 | +24.6% | 524 (G) |
| Illinois | 644 | 5.10 | -2.4% | 5,755 (G) |
| Indiana | 262 | 3.81 | +9.6% | 1,887 (G) |
| Iowa | 177 | 5.51 | +8.6% | 1,353 (G) |
| Kansas | 145 | 4.92 | -1.4% | 1,024 (G) |
| Kentucky | 115 | 2.53 | -6.5% | 902 (G) |
| Louisiana | 155 | 3.37 | -4.9% | 1,083 (H) |
| Maine | 66 | 4.71 | +8.2% | 464 (G) |
| Maryland | 292 | 4.71 | -1.4% | 2,234 (G) |
| Massachusetts | 601 | 8.50 | +6.0% | 5,349 (G) |
| Michigan | 319 | 3.17 | +2.6% | 2,222 (G) |
| Minnesota | 279 | 4.85 | -0.7% | 3,426 (G) |
| Mississippi | 59 | 2.01 | -6.3% | 294 (G) |
| Missouri | 246 | 3.96 | -0.4% | 1,962 (G) |
| Montana | 59 | 5.22 | +11.3% | 353 (G) |
| Nebraska | 117 | 5.88 | +5.4% | 1,028 (G) |
| Nevada | 111 | 3.46 | +6.7% | 620 (H) |
| New Hampshire | 112 | 7.99 | +2.8% | 1,007 (G) |
| New Jersey | 707 | 7.53 | +2.0% | 6,045 (G) |
| New Mexico | 61 | 2.88 | -12.9% | 436 (G) |
| New York | 1,421 | 7.18 | -0.8% | 13,301 (G) |
| North Carolina | 488 | 4.49 | -0.2% | 3,061 (G) |
| North Dakota | 30 | 3.81 | +7.1% | 245 (G) |
| Ohio | 439 | 3.72 | +1.9% | 3,363 (G) |
| Oklahoma | 122 | 3.00 | +4.3% | 754 (G) |
| Oregon | 226 | 5.32 | -7.4% | 1,628 (G) |
| Pennsylvania | 579 | 4.45 | +5.1% | 4,919 (G) |
| Rhode Island | 80 | 7.26 | +9.6% | 423 (G) |
| South Carolina | 159 | 2.95 | 0.0% | 893 (G) |
| South Dakota | 47 | 5.12 | +6.8% | 299 (G) |
| Tennessee | 235 | 3.29 | +15.8% | 1,539 (G) |
| Texas | 1,154 | 3.76 | +9.8% | 7,659 (G) |
| Utah | 283 | 8.20 | +6.0% | 3,108 (G) |
| Vermont | 58 | 8.95 | -4.9% | 456 (G) |
| Virginia | 433 | 4.96 | +1.9% | 3,339 (G) |
| Washington | 521 | 6.65 | +10.6% | 4,044 (G) |
| West Virginia | 46 | 2.60 | -6.1% | 219 (G) |
| Wisconsin | 305 | 5.14 | +8.5% | 2,229 (G) |
| Wyoming | 36 | 6.16 | -20.0% | 308 (G) |
Employment includes all occupations. G/H/J are Census noise flags, explained in the methodology. D.C. is included here, but excluded from the 50-state chart ranking. Full payroll, population, and source flags are in the downloads.
What this tells us about dance studios
Fine arts schools provide a defensible benchmark for the broader instructional sector in which many dance studios operate. The Census definition explicitly includes dance instruction, alongside music, drama, and art. But it does not isolate dance in the published six-digit category. Census: definition of fine arts schools, NAICS 611610.
How many dance studios are there in the U.S.?
This dataset cannot answer that precisely. Calling all 16,284 fine arts school locations "dance studios" would overstate what the data say. It would also miss qualifying dance businesses with no paid employees, which are outside CBP.
What about independent teachers?
We do not publish a nonemployer total for fine arts schools here. The detailed NAICS 611610 industry is not separately available in the NES extract used for this report. A broad educational-services total would include unrelated businesses, so we leave those fields unavailable rather than filling the gap with an unsuitable number.
Is this a market-size estimate?
No. The $2,515,444,000 payroll figure is wages paid by employer establishments, not tuition revenue, household spending on lessons, or total market value. A revenue estimate would require a separate source and a clearly matched industry definition.
Fine arts education: school size and workforce trends
The smaller-establishment share changed as the fine arts school sector grew. In 2019, 54.2% of employer locations had fewer than five employees. By 2023, that share was 50.4%, a decline of 3.8 percentage points. The corresponding location counts were 8,395 and 8,208. These percentages use the same published employment-size band in each year.
The shift suggests a different distribution of reported location sizes, not proof that individual schools expanded. A business can enter or leave the dataset, change its classification, or move between employment bands. Without following the same establishments, the aggregate series cannot show how often a small dance school hired its first additional teacher or grew into a larger facility.
Why the starting year changes the growth story
Fine arts school employment rose from 101,495 in 2021 to 127,068 in 2023, an increase of 25.2%. The increase from 2019 to 2023 was 13.4%. Both calculations are correct, but they use different baselines. Quoting only the larger percentage without its starting year would conceal that distinction.
These are mid-March employment observations, not annual attendance or enrollment totals. They do not reveal whether a school offered more classes, changed class sizes, extended opening hours, or altered its balance of full-time and part-time work. Those operating questions require information from schools themselves. Payroll and employment can describe part of the industry's footprint without measuring student demand.
California and Vermont show why state rankings need context
California added a net 351 employer locations between 2019 and 2023, equivalent to 43.8% of the national net increase of 801. Vermont had the highest 2023 location density among states, but its establishment count declined from 61 to 58. A leading density rank therefore does not necessarily indicate faster recent expansion.
Resident population is a consistent denominator, but it is not a count of prospective students. The age groups served, travel distance, class format, and presence of other instructional providers can matter for a local comparison. This report has not measured those factors, and it does not treat all residents as equally likely buyers of lessons.
Calculations in this section use the published Census County Business Patterns records, the population estimates, and the original records accompanying this report. Business-planning examples below are interpretive guidance, not additional survey findings.
Applying the benchmark to a dance studio or arts school
Dance studio business research should start with the instruction being offered. A school focused on children's group classes, a private music teacher, and an adult art workshop can all be relevant to arts education while serving different needs. A broad industry benchmark is useful for context; a local operating comparison needs a narrower definition.
Build a comparison around the intended student
For a dance school, useful research fields include dance styles, age groups, experience levels, class schedules, lesson format, and location. For a music or art school, instrument or medium and individual versus group instruction may be more relevant. These are proposed comparison fields, not findings in the Census files. The aim is to identify businesses serving a similar student need, rather than treating every fine arts school in a state as a direct competitor.
Published tuition also needs context. A per-class price, a monthly membership, and a multiweek term are different units. Before comparing them, establish the number and duration of lessons, enrollment requirements, and any stated registration or materials charges. Do not infer the effective cost or availability of a program from the business name alone. Our dance studio directory is a starting point for finding operators, with current program details best confirmed directly.
Separate instructional demand from rehearsal-space demand
A dance school that runs its own classes is not necessarily available for independent rehearsal bookings. Conversely, a rehearsal venue may not run an instructional program. A study of dance lessons should focus on comparable teaching offers; a rental study should confirm bookable space, timing, floor suitability, and stated usage conditions. The fine arts school establishment count does not identify either a room inventory or hours available for hire.
Do not turn an employee count into teaching capacity
The employment figure includes all occupations at a school, not only instructors. It does not specify teacher qualifications, lessons delivered, class sizes, or student retention. Even two locations with the same employee count may organize work differently. A staffing or capacity comparison needs a consistent measure such as documented teaching hours or places offered, with the same reference period and a clear explanation of what is included.
What would a dance-only market study require?
A defensible dance-only estimate would need a documented way to identify dance providers inside and outside this broader category, remove duplicates, and distinguish teaching from rental-only operations. It would also need to explain treatment of independent instructors and organizations with several locations. Simply counting the listings in one directory would not establish a national total. Until that work is done, this report offers a broader arts-school benchmark with an explicit boundary, not a precise estimate of the entire dance education market.
Sources, definitions & methodology
This is secondary analysis by Circular Studios, not an original survey or a Census-endorsed report. Firecrawl helped locate and check official source pages. The industry tables come from public Census bulk files, not AI estimates or scraped directory totals.
Coverage and extraction
We downloaded national CBP files for 2019-2023 and state files for 2019 and 2023. We selected NAICS 611610, retaining the total legal-form-of-organization row only. Geography is the 50 states and District of Columbia; Puerto Rico and Island Areas are excluded. State employer-establishment counts reconcile to the national total.
CBP uses 2017 NAICS for these years. This report does not attach the broader NES educational-services category to fine arts schools.
Calculations
- Locations per 100,000 residents: 2023 employer establishments / July 1, 2023 resident population x 100,000. We use the revised 2023 population estimate from Vintage 2025, not the 2025 population.
- 2019-2023 percentage change: (2023 value / 2019 value - 1) x 100. This is net change, not business births, closures, or a causal estimate.
- Small-establishment share: published establishments in the fewer-than-five-employees band / all employer establishments x 100.
- Dollar values: source payroll and receipts in thousands of dollars x 1,000. Values are nominal and are not adjusted for inflation. Displayed percentages are rounded; downloadable ratios retain six decimal places.
Disclosure flags and limitations
The historical CBP layout labels G as noise below 2%, H as 2% to less than 5%, and J as 5% or more. We retain published numeric values with these flags, and preserve the flags in the downloads. N, S, or nonnumeric unavailable/suppressed values become null, not zero. CBP historical record layout (2018-2023).
At the time of review, the Census methodology page carried a notice that its guidance was no longer current while Commerce reevaluated noise infusion. We therefore identify the historical record layout used to interpret these 2019-2023 files; we do not claim that the current methodology notice has been resolved. CBP methodology and current notice.
Administrative coverage, industry classification, disclosure protection, and later revisions can affect comparisons. CBP employment counts all occupations at an establishment around mid-March; it is not an annual average, a full-time-equivalent count, or the count of owners. Geography alone cannot establish unmet demand, business quality, profitability, or the effect of AI.
Download the data & cite this report
The data dictionary documents units, fields, and reuse. The selected original records preserve source values before conversion; the source manifest provides original download URLs and SHA-256 checksums. Both shared files cover the two reports in this research release.
Suggested citation
Circular Studios (September 5, 2026). U.S. Fine Arts School Statistics: 2023 data with 2019-2023 trends. Analysis of U.S. Census Bureau data. https://circularstudios.com/research/fine-arts-school-statistics
Our original analysis, compiled extracts, and charts are offered under Creative Commons Attribution 4.0. Credit Circular Studios and the U.S. Census Bureau, identify any changes, and keep the data year and industry definition with the statistic. We do not claim exclusive rights over the underlying public-domain federal data.
For corrections, source questions, or a chart request, contact Circular Studios. These reports were checked on September 5, 2026; updates require a new source review, not just a changed date.
Source references
Related research
U.S. Photography Business Statistics uses the same employer-data framework, with a different industry definition.
Looking for an actual space? Browse our dance studio directory. Directory coverage is not the statistical universe used in this report.