RESEARCH / NAICS 54192 / 2023 DATA
U.S. Photography Business Statistics
The U.S. had 16,504 photographic services locations with paid employees in 2023. A separate Census series counted 236,666 photography businesses with no paid employees. Here is how the industry changed, and how states compare.
Photography businesses, by the numbers
- Employer establishments (2023):
- 16,504
- Nonemployer businesses (2023):
- 236,666
- Employer locations, change since 2019:
- +11.3%
What is being counted: Photographic services (NAICS 54192): portrait photography studios and commercial photography. Not a count of rentable studio spaces or individual photographers. Census: 2017 NAICS industry names.
- 16,504 employer locations supported 50,967 employees in 2023, with $1,984,665,000 in annual payroll. Employees include all occupations; payroll is not revenue. Census: 2023 County Business Patterns.
- 88.6% of employer locations had fewer than five employees. That is 14,629 of 16,504 establishments in the published size bands. Small does not mean new, owner-operated, or unprofitable. Census: 2023 County Business Patterns.
- California had the most employer locations (2,343), but Hawaii led on locations per resident. Hawaii had 10.10 per 100,000 residents, compared with 4.90 nationally. This is our calculation from Census: 2023 County Business Patterns and Census: state population estimates, Vintage 2025.
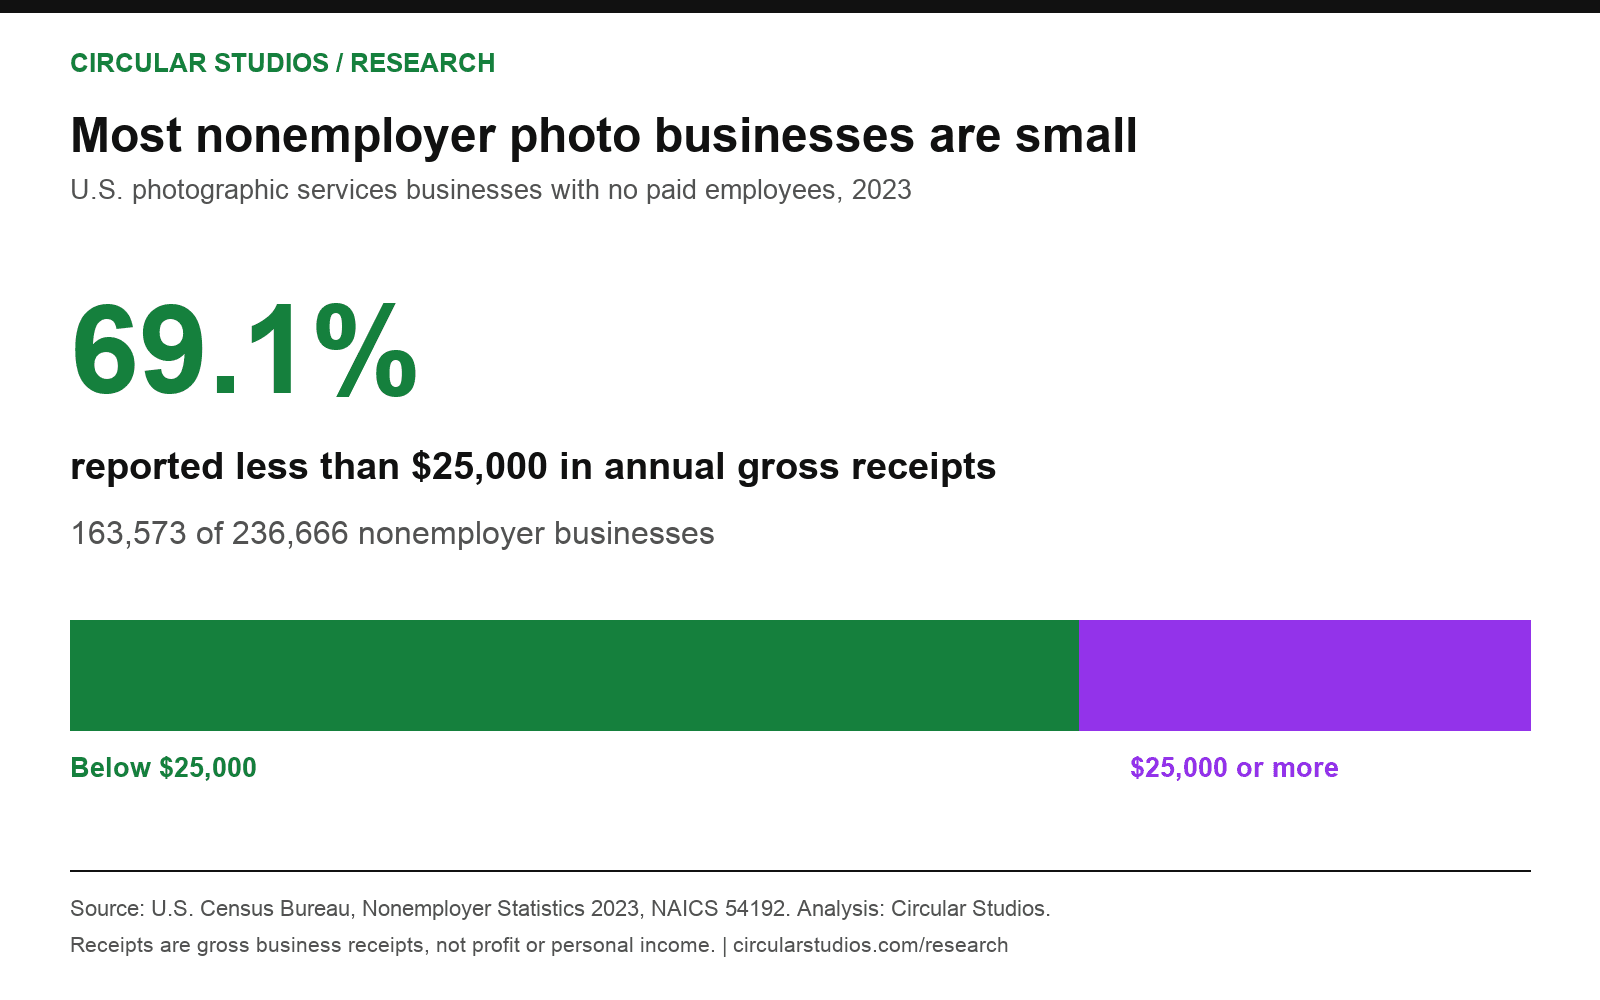
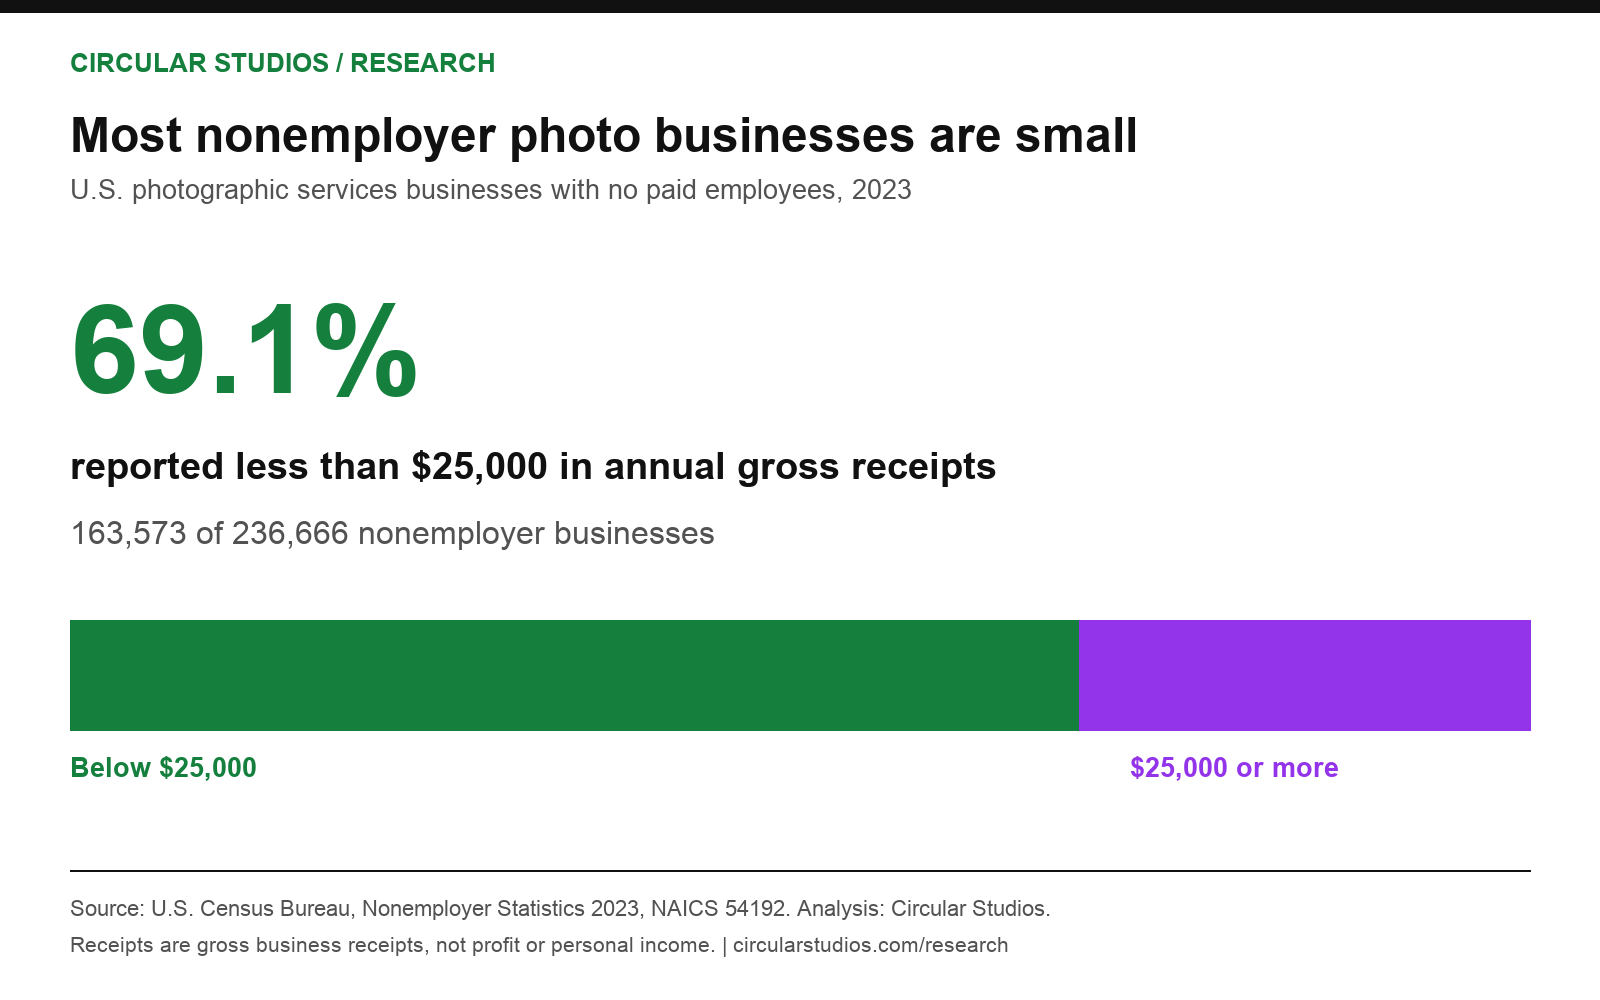
- 69.1% of nonemployer photography businesses reported under $25,000 in annual gross receipts. This describes business receipts, not a photographer's total income or take-home pay. Calculation from the published receipts-size bands in Census: 2023 Nonemployer Statistics.
Industry reference year: 2023, the latest CBP and NES releases found during this review. Population denominator: July 2023, revised in Vintage 2025. The publication date is not the data year.
Planning a space? Use the studio break-even calculator and rental quote worksheet. The tools keep operating assumptions separate from these industry totals.
More photography locations, fewer employees
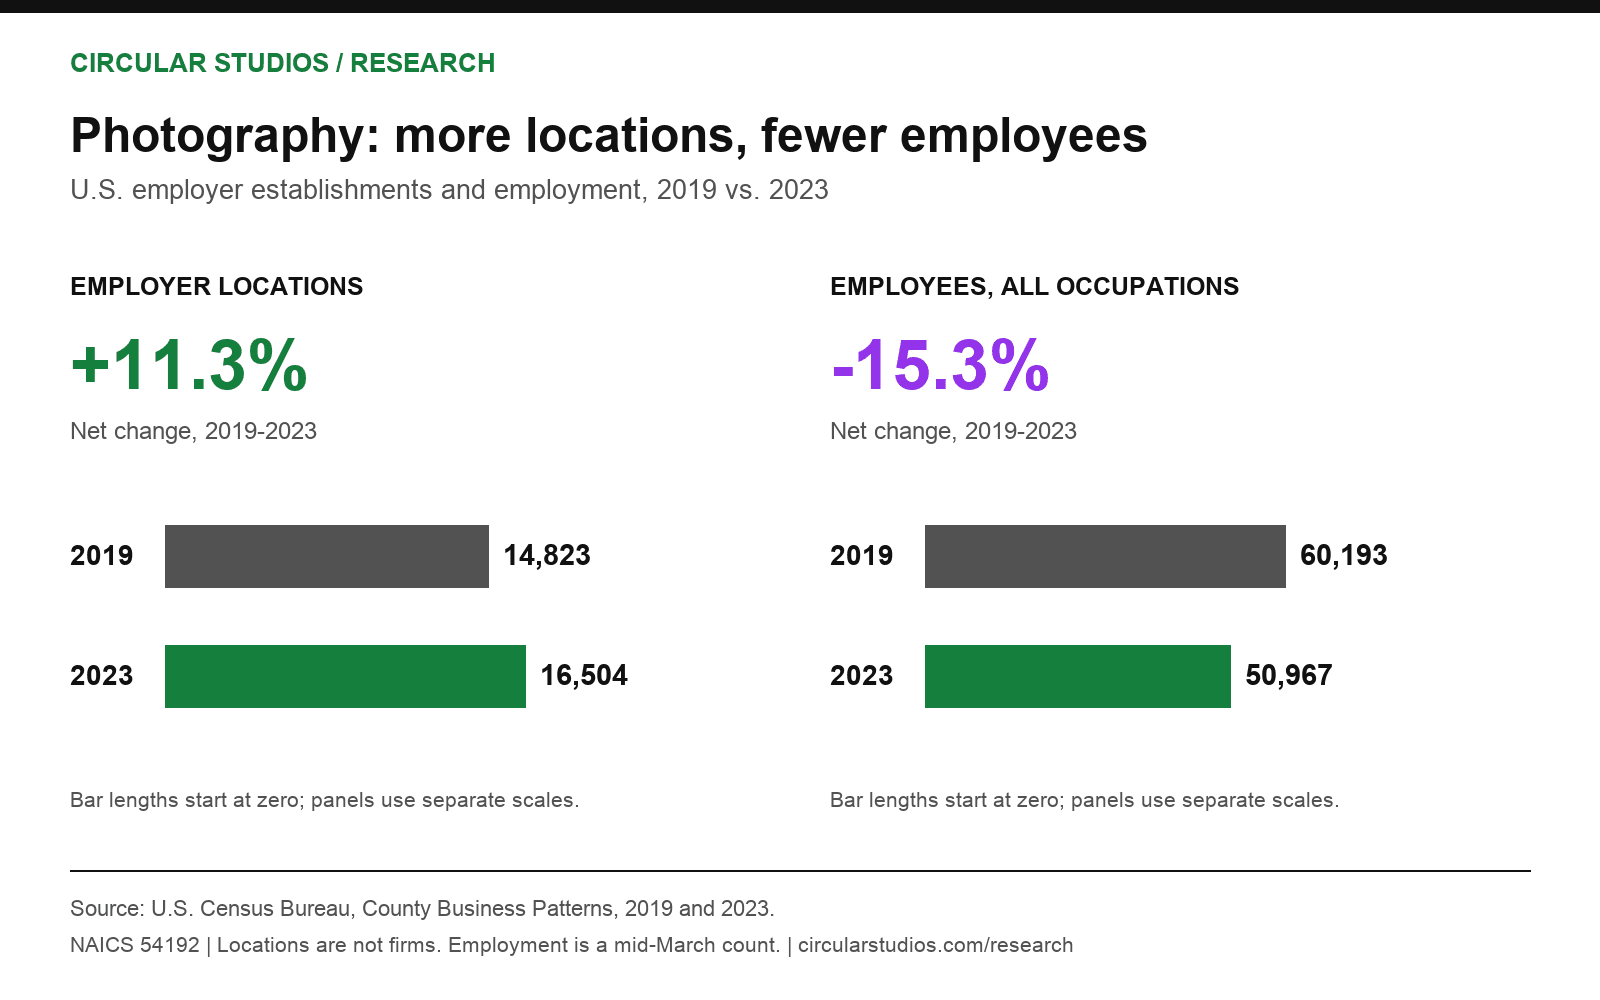
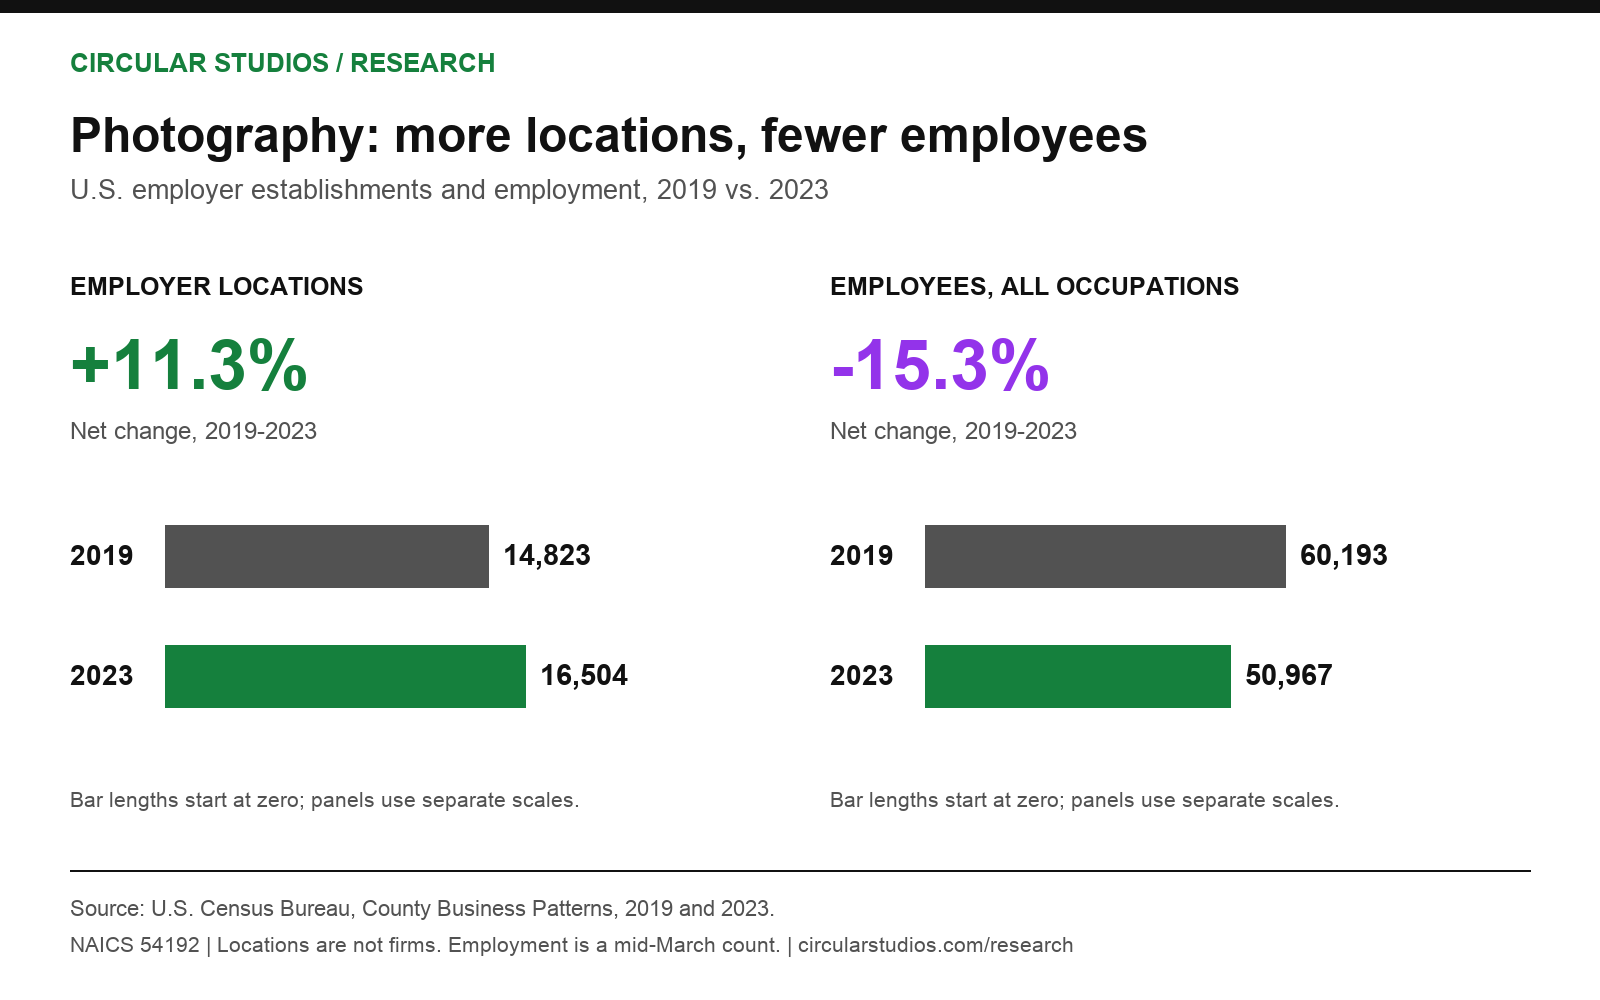
Between 2019 and 2023, photographic services employer establishments increased from 14,823 to 16,504, an increase of 11.3%. Over the same period, employment fell from 60,193 to 50,967, down 15.3%. Calculations use the annual CBP national files listed in the source manifest.
The two measures tell different stories: the number of locations grew, but the published employee count remained below 2019. This does not establish whether work shifted to freelancers, automation, or different business models. The series alone cannot identify a cause.
| Year | Employer locations | Employees | Annual payroll | Locations with <5 employees |
|---|---|---|---|---|
| 2019 | 14,823 | 60,193 (H) | $1,748,258,000 (G) | 12,341 |
| 2020 | 15,032 | 56,042 (H) | $1,501,019,000 (G) | 12,592 |
| 2021 | 15,360 | 43,465 (H) | $1,671,803,000 (G) | 13,676 |
| 2022 | 16,049 | 49,077 (H) | $1,904,138,000 (G) | 14,158 |
| 2023 | 16,504 | 50,967 (H) | $1,984,665,000 (G) | 14,629 |
Employment is measured around mid-March, not averaged across the year. Annual payroll covers the calendar year and is not inflation-adjusted. G/H/J flags reflect Census disclosure protection; see methodology. Net establishment change is not a startup birth or survival rate.
Photography business statistics by state
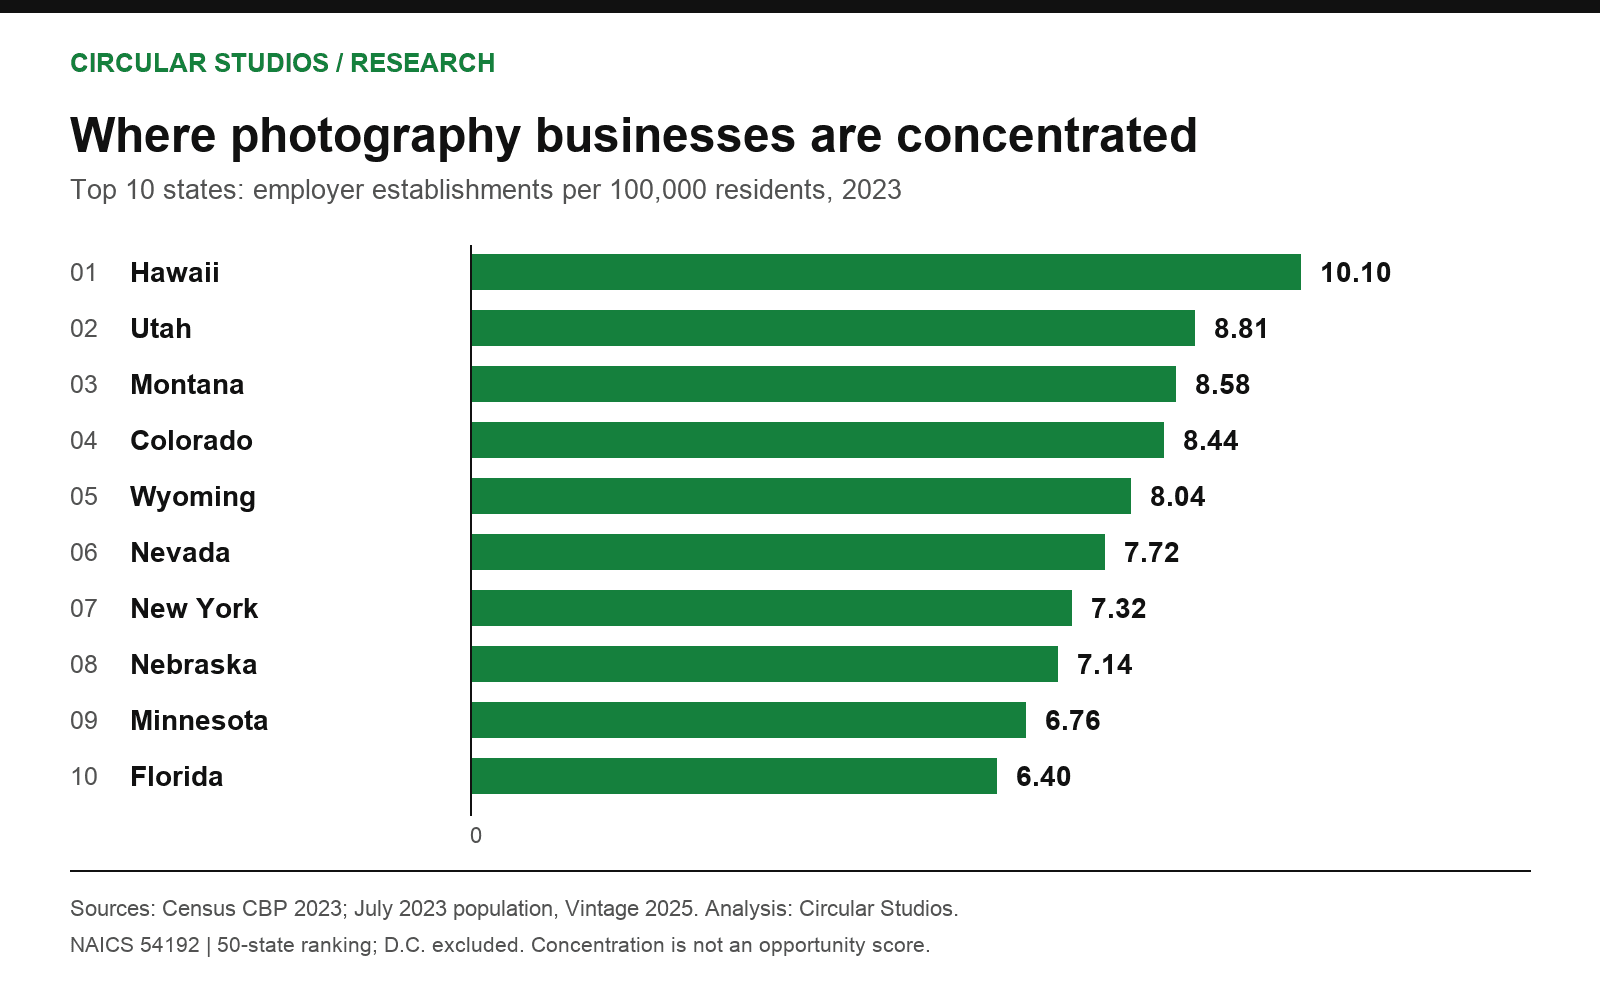
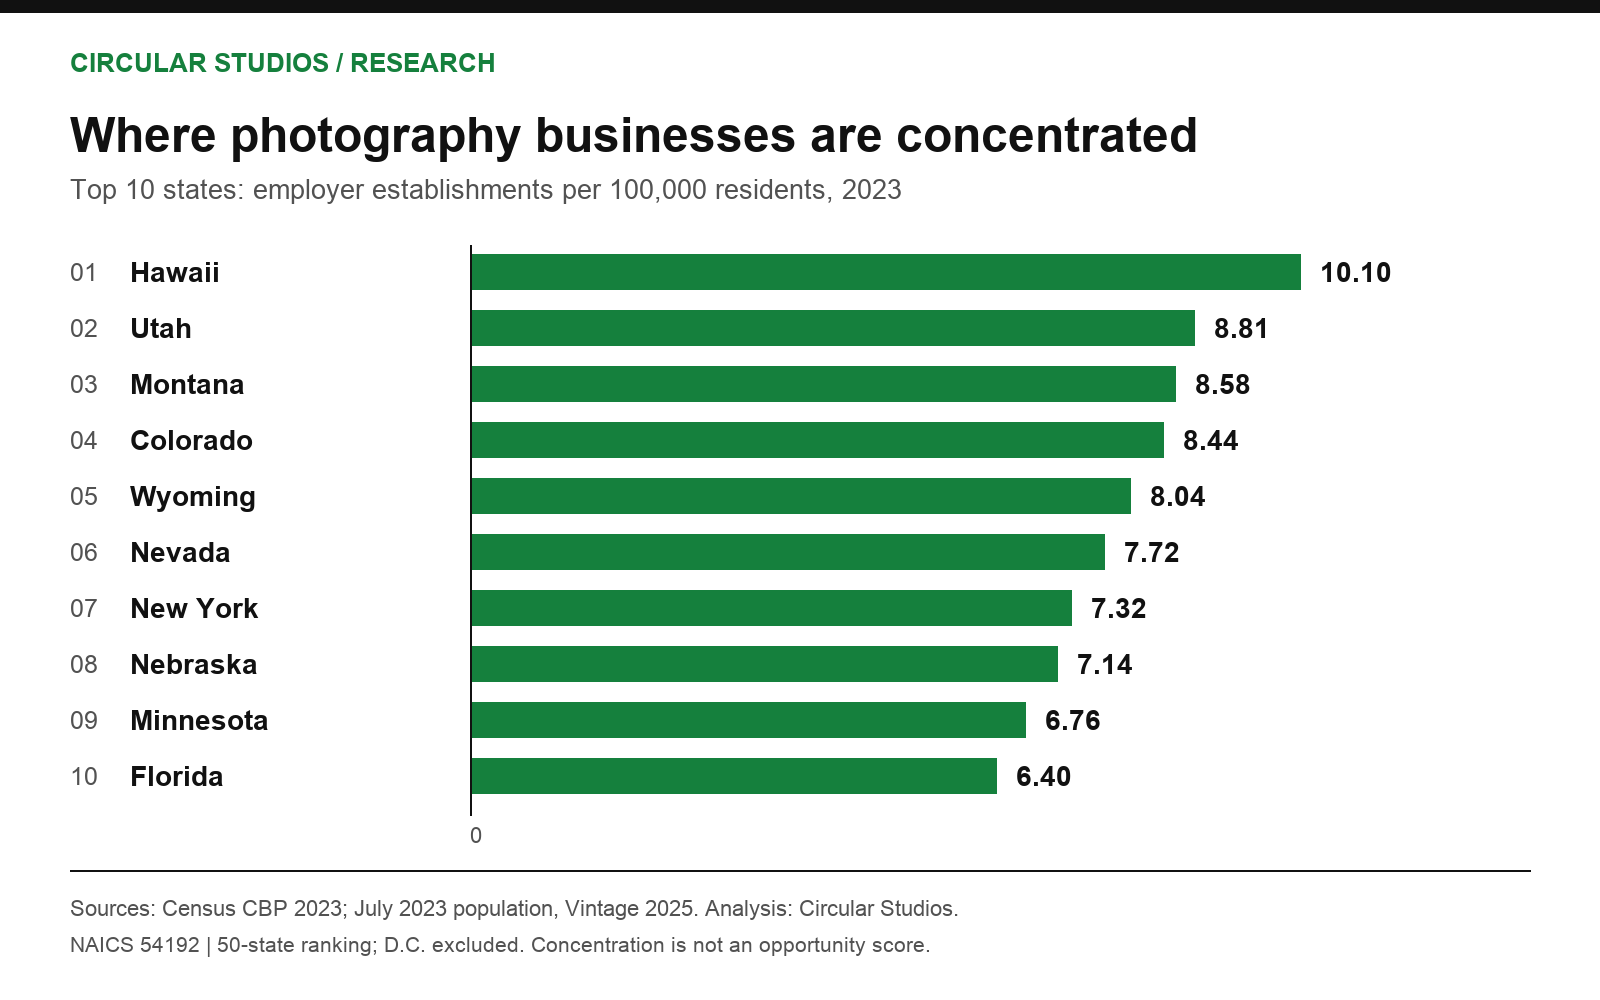
Hawaii (10.10), Utah (8.81), Montana (8.58) lead the 50-state comparison for employer locations per 100,000 residents. Population adjustment changes the picture from a ranking by raw business count. Census: 2023 County Business Patterns; Census: state population estimates, Vintage 2025.
A high ratio can reflect many different conditions, including local demand, tourism, or business structure. We have not tested those explanations. It is not a ranking of the best places to start a studio, and state averages can hide large differences between cities.
51 of 51 areas
| State / district | Employer locations | Per 100,000 residents | Locations, 2019-2023 change | Employees | Nonemployer businesses |
|---|---|---|---|---|---|
| Alabama | 155 | 3.03 | +15.7% | 515 (G) | 2,974 |
| Alaska | 40 | 5.44 | -2.4% | 100 (G) | 598 |
| Arizona | 323 | 4.33 | +27.7% | 958 (G) | 4,569 |
| Arkansas | 102 | 3.32 | +8.5% | 298 (H) | 1,720 |
| California | 2,343 | 5.98 | +21.9% | 6,996 (H) | 28,616 |
| Colorado | 499 | 8.44 | +14.4% | 1,090 (H) | 6,211 |
| Connecticut | 119 | 3.27 | +13.3% | 354 (G) | 2,530 |
| Delaware | 51 | 4.93 | +21.4% | 109 (H) | 587 |
| District of Columbia | 23 | 3.37 | -11.5% | 57 (J) | 540 |
| Florida | 1,468 | 6.40 | +20.0% | 4,534 (H) | 15,788 |
| Georgia | 525 | 4.75 | +21.5% | 1,330 (H) | 8,335 |
| Hawaii | 145 | 10.10 | -5.2% | 485 (G) | 1,548 |
| Idaho | 97 | 4.92 | +24.4% | 271 (H) | 1,821 |
| Illinois | 731 | 5.79 | +5.3% | 2,885 (H) | 7,752 |
| Indiana | 228 | 3.31 | +3.6% | 861 (H) | 4,197 |
| Iowa | 147 | 4.57 | -9.3% | 309 (G) | 2,279 |
| Kansas | 122 | 4.14 | +4.3% | 247 (H) | 1,987 |
| Kentucky | 119 | 2.62 | +13.3% | 263 (J) | 2,497 |
| Louisiana | 166 | 3.61 | -3.5% | 456 (H) | 2,753 |
| Maine | 70 | 4.99 | +2.9% | 124 (G) | 1,231 |
| Maryland | 247 | 3.98 | +5.1% | 947 (J) | 4,390 |
| Massachusetts | 290 | 4.10 | +1.8% | 1,022 (G) | 4,928 |
| Michigan | 338 | 3.36 | -0.6% | 1,037 (H) | 7,032 |
| Minnesota | 389 | 6.76 | -2.5% | 1,062 (J) | 4,675 |
| Mississippi | 62 | 2.11 | +3.3% | 189 (H) | 1,359 |
| Missouri | 295 | 4.75 | +5.4% | 2,166 (H) | 4,323 |
| Montana | 97 | 8.58 | +34.7% | 127 (H) | 1,266 |
| Nebraska | 142 | 7.14 | +6.0% | 307 (H) | 1,455 |
| Nevada | 248 | 7.72 | +32.6% | 947 (H) | 2,045 |
| New Hampshire | 55 | 3.92 | +25.0% | 225 (G) | 1,118 |
| New Jersey | 396 | 4.21 | +8.5% | 1,130 (H) | 6,242 |
| New Mexico | 73 | 3.44 | +14.1% | 199 (H) | 1,093 |
| New York | 1,448 | 7.32 | -0.8% | 3,096 (H) | 15,795 |
| North Carolina | 502 | 4.62 | +8.4% | 2,103 (G) | 7,266 |
| North Dakota | 39 | 4.96 | 0.0% | 162 (G) | 627 |
| Ohio | 398 | 3.37 | -3.9% | 1,500 (G) | 7,608 |
| Oklahoma | 143 | 3.52 | +9.2% | 361 (H) | 2,577 |
| Oregon | 255 | 6.00 | +15.4% | 630 (H) | 3,741 |
| Pennsylvania | 474 | 3.64 | +2.2% | 1,695 (G) | 7,910 |
| Rhode Island | 57 | 5.18 | +5.6% | 229 (H) | 815 |
| South Carolina | 232 | 4.30 | +20.2% | 482 (J) | 3,731 |
| South Dakota | 54 | 5.88 | +1.9% | 132 (G) | 841 |
| Tennessee | 236 | 3.30 | +18.6% | 1,235 (G) | 5,505 |
| Texas | 1,118 | 3.64 | +20.3% | 3,751 (H) | 20,012 |
| Utah | 304 | 8.81 | +28.8% | 778 (G) | 3,451 |
| Vermont | 35 | 5.40 | +9.4% | 56 (J) | 567 |
| Virginia | 386 | 4.42 | +17.0% | 1,004 (H) | 6,045 |
| Washington | 384 | 4.90 | +15.7% | 1,080 (G) | 5,961 |
| West Virginia | 28 | 1.58 | -17.6% | 154 (J) | 905 |
| Wisconsin | 259 | 4.37 | +5.3% | 844 (H) | 4,284 |
| Wyoming | 47 | 8.04 | -7.8% | 75 (J) | 566 |
Employment includes all occupations. G/H/J are Census noise flags, explained in the methodology. D.C. is included here, but excluded from the 50-state chart ranking. Full payroll, population, and source flags are in the downloads.
Businesses without paid employees are a separate story
Census counted 236,666 nonemployer photographic services businesses in 2023, with $6,823,388,000 in gross receipts. These businesses have no paid employees, are subject to federal income tax, and generally have at least $1,000 in annual receipts. They can include side businesses as well as full-time operations. Census: 2023 Nonemployer Statistics.
Adding the three published receipts bands below $25,000 gives 163,573 businesses, or 69.1% of the nonemployer total. Expenses have not been deducted. Do not describe this as the share of photographers earning less than $25,000.
| Annual gross receipts | Businesses | Share of total |
|---|---|---|
| Less than $5,000 | 70,836 | 29.93% |
| $5,000-$9,999 | 40,433 | 17.08% |
| $10,000-$24,999 | 52,304 | 22.10% |
| $25,000-$49,999 | 33,972 | 14.35% |
| $50,000-$99,999 | 24,760 | 10.46% |
| $100,000-$249,999 | 12,290 | 5.19% |
| $250,000-$499,999 | 1,627 | 0.69% |
| $500,000-$999,999 | 371 | 0.16% |
| $1,000,000-$2,499,999 | 73 | 0.03% |
Rows cover all businesses in the published 2023 national total; rounded percentages may not sum to exactly 100%. We have not manufactured zero-count rows for unpublished bands.
How many photographers are there?
That is a different question. The BLS Occupational Outlook Handbook reports 145,000 photographer jobs in 2025, with 67% self-employed. That is an occupation-based measure in a later year, not a business count. It should not be substituted for or added to the Census industry totals. BLS: photographers, Occupational Outlook Handbook.
Are all of these photography studios?
No. The employer total combines 11,483 portrait photography studio establishments (NAICS 541921) and 5,021 commercial photography establishments (NAICS 541922). Neither category is a verified inventory of studio space available to rent. Census: 2017 NAICS industry names; Census: 2023 County Business Patterns.
Portrait and commercial photography: understanding the business mix
Portrait photography studios accounted for 69.6% of photographic-services employer locations in 2023. Commercial photography accounted for the remaining 30.4%. These shares divide each six-digit industry's establishment count by the 16,504-location total; they describe the mix of employer locations, not the share of customers or photography spending.
Location share is different from employment share
The portrait category reported 37,479 employees, compared with 13,488 in commercial photography. Portrait establishments therefore accounted for 73.5% of the published employee count, a larger share than their share of locations. Employment includes every occupation at these establishments, including non-photography roles. It does not measure the number of working portrait photographers.
This distinction matters when comparing photography business models. An industry with more employees per location is not necessarily more productive, more profitable, or a better investment. The figures do not include hours worked, service prices, owner labor, or the number of shoots completed. A location is an administrative counting unit, not a standardized package of equipment, floor space, or capacity.
California and Hawaii illustrate two different market measures
California's employer-location count increased by 421 between 2019 and 2023. That represented 25.0% of the national net increase of 1,681 locations. This is a contribution to net change, not a count of new photography-business launches: openings, closures, and classification changes cannot be separated in these totals.
Hawaii, meanwhile, led the per-resident comparison even though its employer count fell from 153 to 145. A state can have high photography-business concentration and a declining establishment count at the same time. Density, absolute size, and direction of change answer different questions. None, on its own, establishes whether a particular city needs another portrait service or rental studio.
Calculations in this section use the published Census County Business Patterns records, the population estimates, and the original records accompanying this report. Business-planning examples below are interpretive guidance, not additional survey findings.
Using photography industry statistics in a studio business plan
A national benchmark is a starting point for describing an industry, not a substitute for researching a specific photography business. The useful sequence is to define the service, identify comparable local operators, and then decide which national statistic actually describes that market. Keep rental demand, photography-service demand, and employment separate throughout that process.
Define whether you sell photography or studio access
A portrait business sells a photographic service. A studio-rental business offers access to a space, often measured by bookable time. A venue may do both, but the Census industry totals do not identify which establishments accept outside bookings. For rental research, verify that a business actually rents space before treating it as a competitor. For service research, compare the type of work and customer need rather than counting every business with "studio" in its name.
Compare the same service, geography, and price unit
For a practical local comparison, record the service area, portrait or commercial specialty, published offer, and inquiry or booking route. A rental comparison should additionally distinguish hourly rates from session packages, minimum booking duration, included equipment, and any stated mandatory fees. These are fields to investigate, not attributes that can be inferred from a Census code. An apparently lower headline rate is not comparable until the underlying booking terms match.
State totals are too broad to identify a neighborhood-level supply gap. Compare operators that could realistically serve the same customer, then document what remains unknown. Our photography directory can help identify businesses to investigate, but it is not a statistically complete sample or proof of rental availability. Confirm current services directly with the operator.
Keep revenue, receipts, payroll, and owner income separate
The nonemployer receipts distribution describes gross business activity before expenses. It does not show household income, billable hours, or how many owners run photography as a secondary business. Employer payroll measures wages paid, not customer revenue. Combining those two dollar measures would not produce a defensible photography market-size estimate. Likewise, dividing payroll by a mid-March employee count does not produce a reliable annual photographer salary.
What evidence would support a startup or AI-impact claim?
A claim about business survival needs a defined starting group and observations of those same businesses over time. A claim about the effect of AI needs evidence that distinguishes that effect from other changes. This report has neither design. Its establishment and employment trends can motivate further research, but cannot establish a startup success rate or explain why staffing changed. A business plan should describe these limits alongside the supporting numbers, not turn an industry trend into an unsupported forecast.
Sources, definitions & methodology
This is secondary analysis by Circular Studios, not an original survey or a Census-endorsed report. Firecrawl helped locate and check official source pages. The industry tables come from public Census bulk files, not AI estimates or scraped directory totals.
Coverage and extraction
We downloaded national CBP files for 2019-2023 and state files for 2019 and 2023. We selected NAICS 54192, retaining the total legal-form-of-organization row only. Geography is the 50 states and District of Columbia; Puerto Rico and Island Areas are excluded. State employer-establishment counts reconcile to the national total.
CBP uses 2017 NAICS for these years. The 2023 NES extract uses 2022 NAICS and the same 54192 photographic-services category; we retain its distinct nonemployer universe. NES methodology changed in 2022, so this report does not calculate historical nonemployer growth across that break. Nonemployer Statistics: methodology changes.
Calculations
- Locations per 100,000 residents: 2023 employer establishments / July 1, 2023 resident population x 100,000. We use the revised 2023 population estimate from Vintage 2025, not the 2025 population.
- 2019-2023 percentage change: (2023 value / 2019 value - 1) x 100. This is net change, not business births, closures, or a causal estimate.
- Small-establishment share: published establishments in the fewer-than-five-employees band / all employer establishments x 100.
- Dollar values: source payroll and receipts in thousands of dollars x 1,000. Values are nominal and are not adjusted for inflation. Displayed percentages are rounded; downloadable ratios retain six decimal places.
Disclosure flags and limitations
The historical CBP layout labels G as noise below 2%, H as 2% to less than 5%, and J as 5% or more. We retain published numeric values with these flags, and preserve the flags in the downloads. N, S, or nonnumeric unavailable/suppressed values become null, not zero. CBP historical record layout (2018-2023).
At the time of review, the Census methodology page carried a notice that its guidance was no longer current while Commerce reevaluated noise infusion. We therefore identify the historical record layout used to interpret these 2019-2023 files; we do not claim that the current methodology notice has been resolved. CBP methodology and current notice.
Administrative coverage, industry classification, disclosure protection, and later revisions can affect comparisons. CBP employment counts all occupations at an establishment around mid-March; it is not an annual average, a full-time-equivalent count, or the count of owners. Geography alone cannot establish unmet demand, business quality, profitability, or the effect of AI.
Download the data & cite this report
The data dictionary documents units, fields, and reuse. The selected original records preserve source values before conversion; the source manifest provides original download URLs and SHA-256 checksums. Both shared files cover the two reports in this research release.
Suggested citation
Circular Studios (September 5, 2026). U.S. Photography Business Statistics: 2023 data with 2019-2023 trends. Analysis of U.S. Census Bureau data. https://circularstudios.com/research/photography-business-statistics
Our original analysis, compiled extracts, and charts are offered under Creative Commons Attribution 4.0. Credit Circular Studios and the U.S. Census Bureau, identify any changes, and keep the data year and industry definition with the statistic. We do not claim exclusive rights over the underlying public-domain federal data.
For corrections, source questions, or a chart request, contact Circular Studios. These reports were checked on September 5, 2026; updates require a new source review, not just a changed date.
Source references
- Census: 2023 County Business Patterns
- County Business Patterns: latest available data
- CBP methodology and current notice
- CBP historical record layout (2018-2023)
- Census: state population estimates, Vintage 2025
- Census: 2017 NAICS industry names
- Census: 2023 Nonemployer Statistics
- Nonemployer Statistics: methodology changes
- BLS: photographers, Occupational Outlook Handbook
Related research
U.S. Fine Arts School Statistics uses the same employer-data framework, with a different industry definition.
Looking for an actual space? Browse our photography studio directory. Directory coverage is not the statistical universe used in this report.